Hello!
The only up only price chart of Bitcoin is this one:
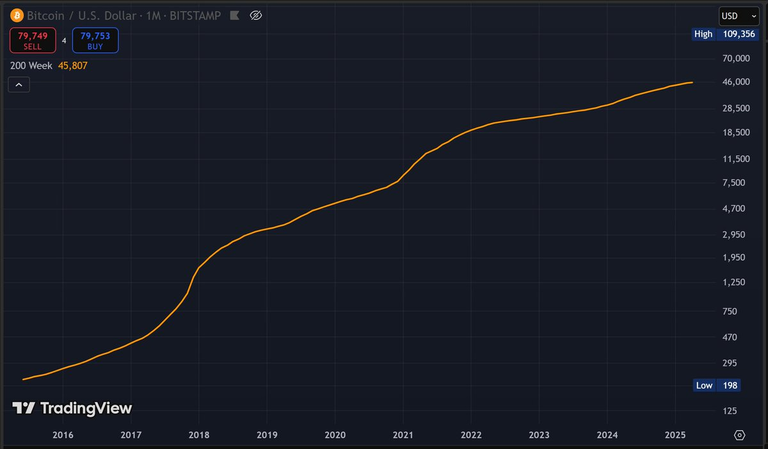
It shows the Bitcoin average price of the previous 200 weeks. It's the same as measuring the average price of the last 4 years and then printing the results in a chart. On that price we can see that the trend is always going up.
It's an indicator that shows you the evolution of the Bitcoin price without the volatility we normally have in the 4 year cycles. The direction is clear, you don't need a high IQ to see that there is nothing stopping this train (as Lyn Alden says).
The chart was published by @Cole_Walmsley in twitter. Twitter is my main source of information, I usually spend some time looking for Bitcoin related information. If everything happens, you will see it there first.
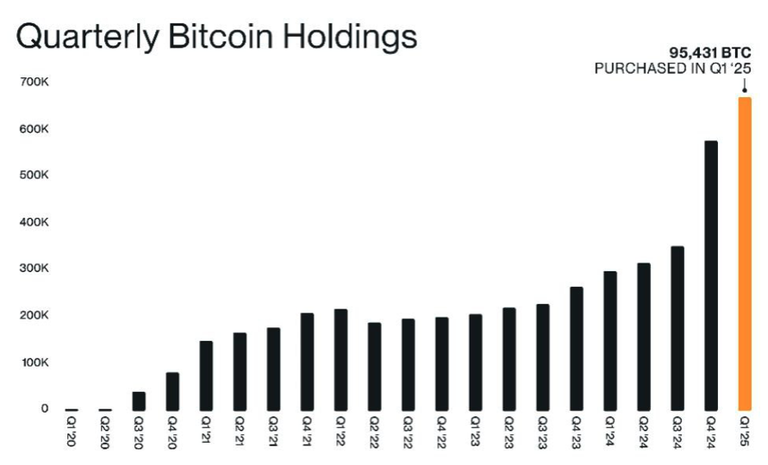
Another good piece of content I found today is the photo about quarterly Bitcoin Holdings for corporations. As you can see in the image, worldwide corporations bought over 95,000 Bitcoin in the first quarter of 2025! This is the most of any quarter ever. Quite bullish news for Bitcoin corporation adoption.
Another important thing to notice is that Bitcoin is trading at higher prices than 2020, 2021, 2022, 2023… So, it’s harder to stack more Bitcoin as the price is higher than the other years. This would probably mean that more and more corporations are joining the race. They will not want to get left behind.
Forget the noise, forget the volatility, this is signal. Corporations are stacking sats harder than ever before. Sure, the price is not following, but it eventually will. Don’t forget that when Bitcoin moves, it moves very fast and the sentiment of the market can switch in a couple of days of green. FOMO can kick in at any time, be prepared.
I hope you have a great day!
Posted Using INLEO