Hello again and welcome to a new edition of my weekly technical analysis of $HIVE & $BTC. Let's see where we are with these two assets.
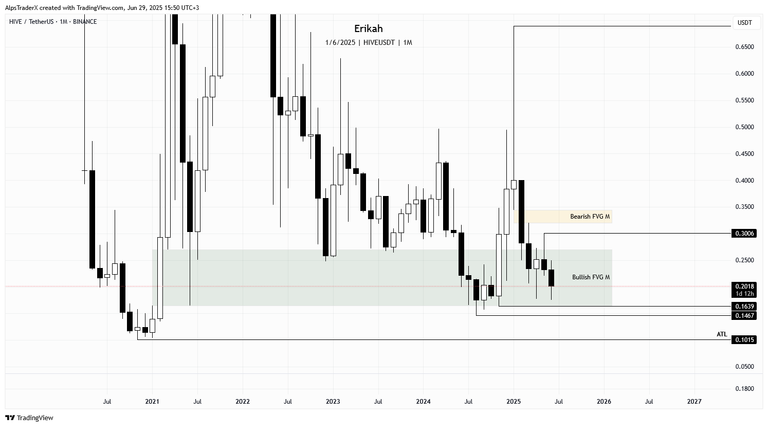
The monthly candle closes tomorrow and we're going to know exactly what it's going to be, but by the look of it, if nothing major happens, we are going to have a bearish candle and price still inside the bullish gap, which has been holding price for ages now. Would be great to see price close above the gap and hold, for bullish continuation, but that's not going to be tomorrow.
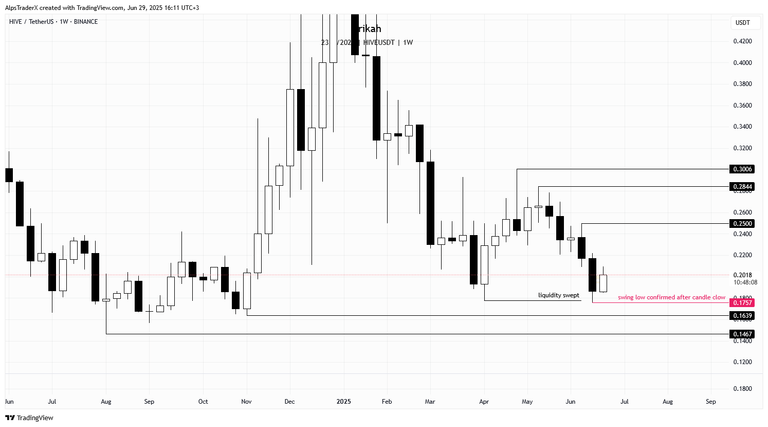
The weekly chart looks a bit better this time. Last week price swept liquidity from the swing low at $0.1775, as mentioned in my previous post. Still 10 hours to go till the candle close, but so far we have a nice bullish gap. After the current candle close, $0.1757 will be confirmed as the swing low and it becomes my next target in case of weakness.
For bullish continuation, price needs to close above $0.2366 and hold, in which case this level will mean the bullish order block (OB) too. Let's see where price wants to go next. In case of bullish continuation, levels to watch are $0.25, $0.2844 and $0.3006.
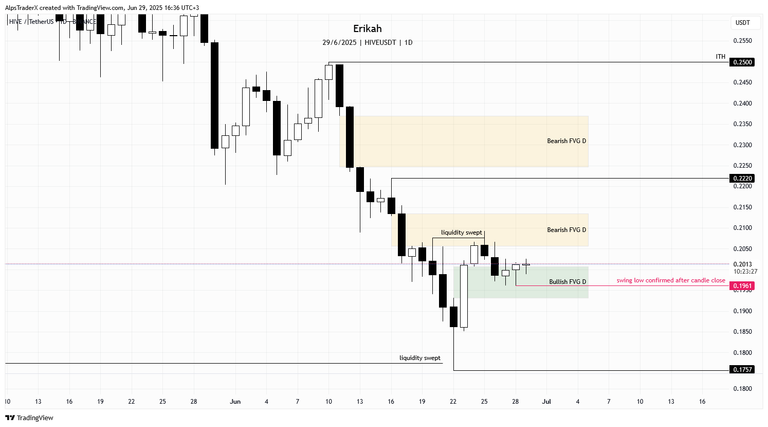
The daily chart shows a bit of indecision. Price is sandwiched between a bearish and a bullish gap and at the moment has no idea which way to go. Swept liquidity from $0.2077 and got rejected. Retested the bullish gap that has been holding price this week. Yesterday's candle closed above the gap, but today so far we have a doji, which means indecision.
After today's candle close, $0.1961 will be confirmed as swing low and can be a target to sweep in case of weakness in the market. In case of some momentum, I'm expecting price to sweep liquidity from the $0.2093 and if price can close above $0.2128, the next target on the upside is $0.222. Next is another bearish gap, marked with yellow on my chart, which is going to act as resistance. I'd say let's get to $0.222 first, then we'll see.

On a more granular scale, the h4 chart shows price is above the bullish gap, marked with green on the chart, which has been fully rebalanced and is still holding price. At the time of writing, price is between an equal high and an equal low, which is pretty rare. In 4 years of trading, I've never seen such a clear range defined by an equal high and an equal low, although I'm checking a bunch of charts on a daily bases.
For those of you who don't have the ability to read the chart or understand the terms, equal highs and equal lows act like a magnet and attract price and the liquidity above or below these levels are double. Which one is going to be swept first we don't know. Price has just created the equal high and rejected price at the time of writing.
It's Sunday, there's no news catalyst at the moment, unless something happens on the Geo-political level.
In case of weakness, I'd look at $0.1961 to be swept and if something really bad happens, than $0.1863 is possible as well. In case of bullish continuation, the next obvious target is $0.2026, $0.2053, $0.2067 and ultimately $0.2093, which is the swing high.
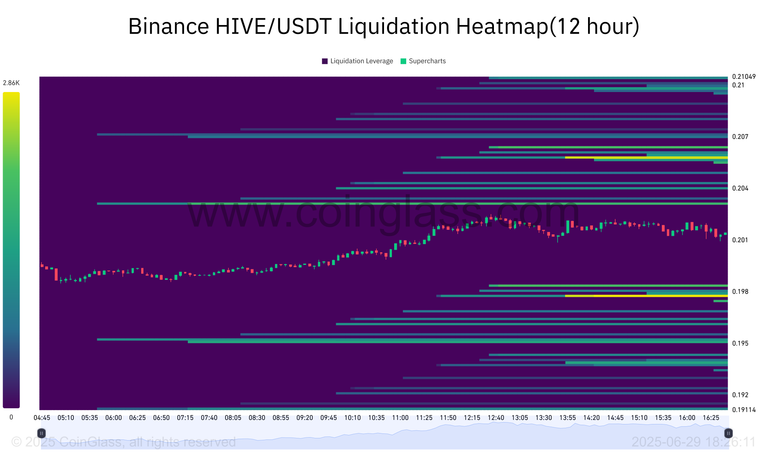
I'm not a huge fan of liquidation maps because so many times turned out unreliable, but still, sometimes it's good to have a look at it.
This is the h12 map and as you can see, price is going sideways not, between two important liquidation levels, which are $0.19774 and $0.2058. Tomorrow we'll know more, price is going to reveal which way it wants to go.
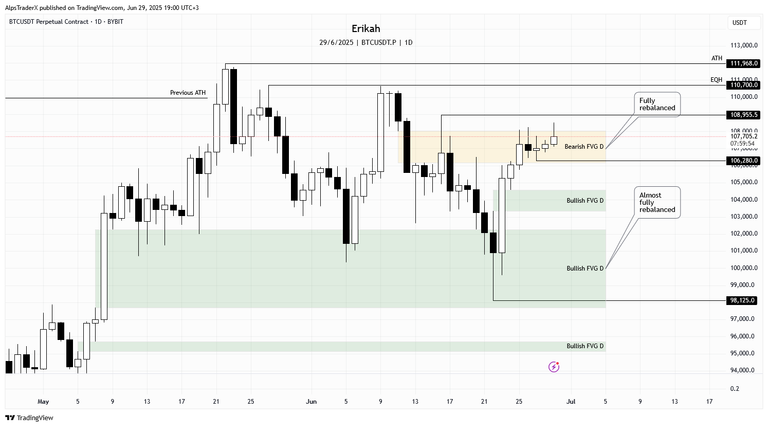
Compared to last week, $BTC has made significant progress to the upside. At the time of writing last week, price was at $99,980, while at the moment 1 $BTC is trading at $107,780. Price is inside a bearish gap, that has been fully rebalanced, but it is capping the market for 15 days now, as price has not been able to close above it yet. I'm not interested in the gap anymore, but I'll leave it on the chart, till price manages to close above it. For me, more interesting and important is the swing high at $108,955, which is next to be swept, on the upside, after which comes the equal high at $110,700.
In case of weakness, I'm expecting price to retest the bullish gap below the current range. If the gap can't defend price, we're going back to $95,125. However, let's not forget, $BTC is $4k away from the current ATH. One big push and we can get a new ATH.
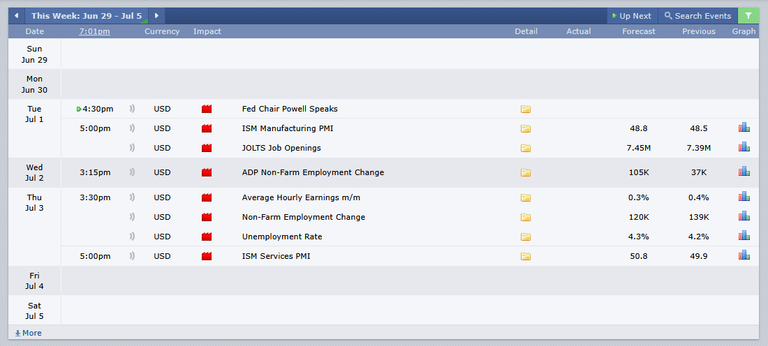
Next week we have three red folder news days, so we have Monday off, to let price establish Monday high and Monday low, then trade starting from the next day.
Remember, technical analysis is not about forecasting price, but about reacting to what price does.
As always, this is a game of probabilities, not certainties. Also please note, this is not financial advice, it's my view and understanding of the market.
All charts posted here are screenshots from Tradinview.
Come trade with me on Bybit.

If you're a newbie, you may want to check out these guides:
- Communities Explained - Newbie Guide
- Cross Posting And Reposting Explained, Using PeakD
- Hive Is Not For Me
- How To Pump Your Reputation Fast - Newbie Guide
- Tips And Tricks & Useful Hive Tools For Newbies
- More Useful Tools On Hive - Newbie Guide
- Community List And Why It Is Important To Post In The Right Community
- Witnesses And Proposals Explained - Newbie Guide
- To Stake, Or Not To Stake - Newbie Guide
- Tags And Tagging - Newbie Guide
- Newbie Expectations And Reality
- About Dust Vote And Hive Reward Pool, by libertycrypto27