This is the second week of this year 2024 and celebration time for the New Year has already gone. Now it is time to focus on the work and here I am to talk about the analytics for my Twitter account. I was on vacation in New Year's time and this is why I was not very active on Twitter. Last week I discussed about the analytics I was able to achieve that time and most of the metrics were read however now it is time to talk about another week and this week's situation has improved. As I always say there's consistency is very important and now since I worked every day without missing this week improvement is visible in different numbers.

I was not active last week but this week I was and I tried working on different metrics which can be seen on the below analytic snapshot-
Here is this week's progress report for X-
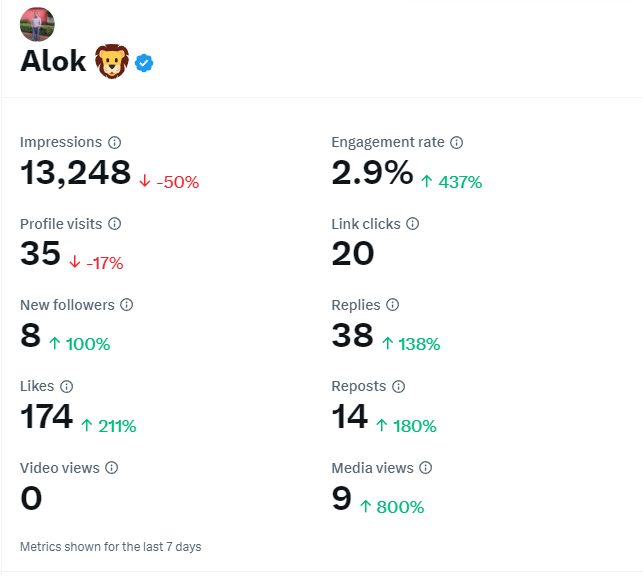
This week is from the 25th Dec to the 31st of December 2023. Last week's numbers were down. Below is the snapshot of last week's report
This week's Progress (Analytics)
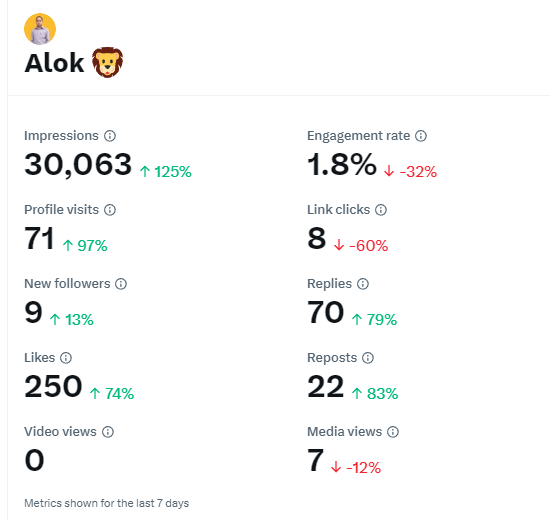
This is my X (Twitter) analytics for this week. As I said this week the improvement is visible on most of the metrics and below is the snapshot for the same. The analytics are for the last seven days and some components like engagement rate link clicks and media views are slightly down but the rest are in green with a significant percentage. Every time getting green on everything with a big number is not feasible but it's fine because sometimes I focus on the impression and sometimes on the engagement rate this time I focused on the impression and probably the next week will be more on the engagement side but let's see how I plan to do it.

Impression count is up by 125% and on the count side its 30k+ and I think its a good improvement.
Profile visits have gone up by 97% which is almost double from the last week and ultimately these profile widgets are turning out to be new fall over count later on.
The count of likes has also increased by 74% and this number is reflected as 250 which is again a good number altogether and hopefully, it will grow like this in the coming weeks.
Some other metrics including the new follow-up replies and reposts are also increased and since I did not post any video hence that count is zero which makes sense.
Last week's Analysis
This is the snapshot from last week to have a comparison between both. This week the focus was more on the engagement rate and this is why the impression count is down now with the updated week the count for the impressions has gone up whereas the engagement rate is down. It's like both are two different metrics that cannot be grown together because if I focus on one the other is missed but maybe I will see if I can focus on both at the same time.

Top Tweet for the week
This is the top to eat for this week which has got 600 plus impressions and 54 engagements with an engagement rate of 9%. The tweet is about the splinterlands game and how the tokens and assets are getting better in terms of market value and it is also because of the rebellion introduction in the game and land launch. It shows that people like the content related to Web 3 games and crypto of course and undoubtedly the game is amazing and is based on nft cards.

Here is the overall activity for the last 7 days and this week also I have been consistent.

This is the update for this week and now I'll be trying to focus on the next week. Monday to Saturday are the days when I walk on Twitter and Saturday is the day when I try to spend more time on the engagement and various activities. This week the news about India in which the FIU notice has been issued to the exchanges already and now the government has started banning the exchange website and applications from the App Store. I was active more than the normal time because of this update and it went well hence I am thinking that I need to follow the similarity strategy and the ultimate goal is to grow my Twitter account.
My X account- https://twitter.com/alok9811
[images are from my Twitter account wherever source is not mentioned]
Thank you

