
As the project is one of the projects that I like, despite only having a few hundred ALIVE, I decided to create a weekly report where we can follow the evolution of the token's tokenomics.
Why weekly and not daily?
Because I think a daily post about this, it will be like spam.
ALIVE
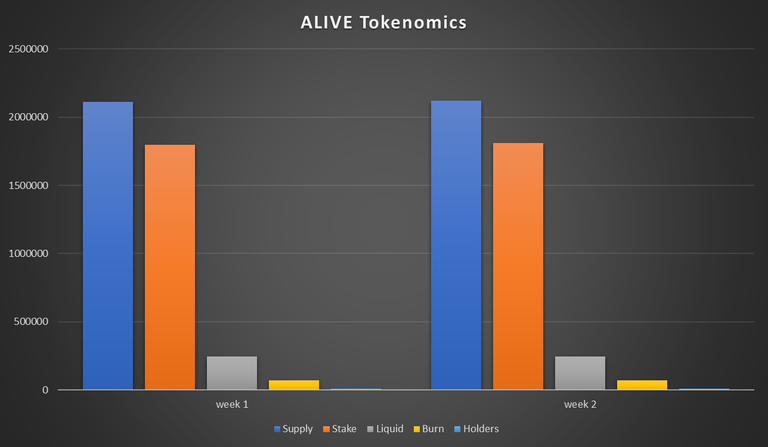
| Supply | Stake | Liquid | Burn | Holders | |
|---|---|---|---|---|---|
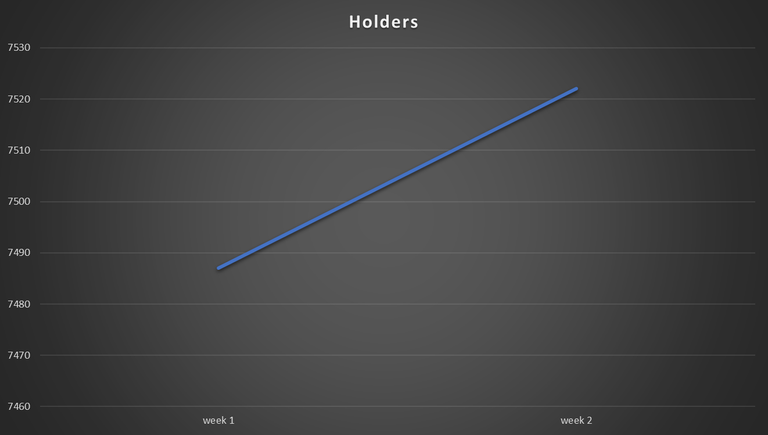
| week 1 | 2111137.387 | 1799070.217 | 242922.2725 | 69144.8976 | 7487 |
| week 2 | 2122911.872 | 1808529.921 | 244723.0835 | 69658.8669 | 7522 |
Comparing with the previous week, we have 11774 increase in supply, 9459.704 more ALIVE staked, more 1800.811 ALIVE liquid, more 513.9693 ALIVE burned and 35 new holders.
| Inflation | |
|---|---|
| week 1 | 0.55% |
| week 2 | 0.56% |
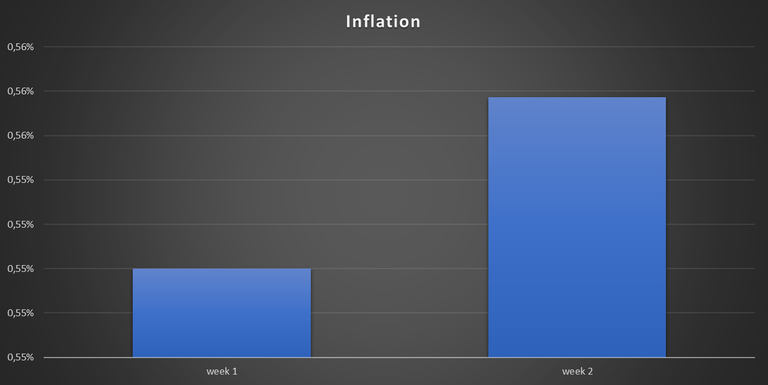
ALIVE current average inflation is 0.55%
| Supply | Stake | Liquid | Burn | Holders | |
|---|---|---|---|---|---|
| week 1 | 0.55% | 0.60% | 0.08% | 0.85% | 0.58% |
| week 2 | 0.56% | 0.53% | 0.74% | 0.74% | 0.47% |
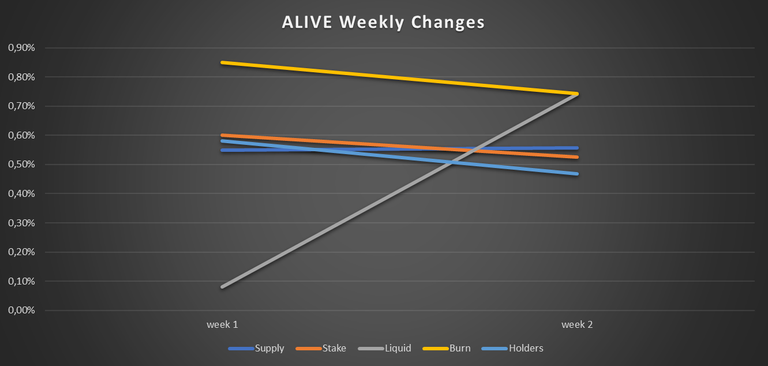
This means our supply increased 0.56%, the ALIVE staked increased 0.53%, the liquid ALIVE increased 0.74%, ALIVE burned increased 0.74% and holders increased 0.47%.
ALIVEM
ALIVEM is the ALIVE miner.
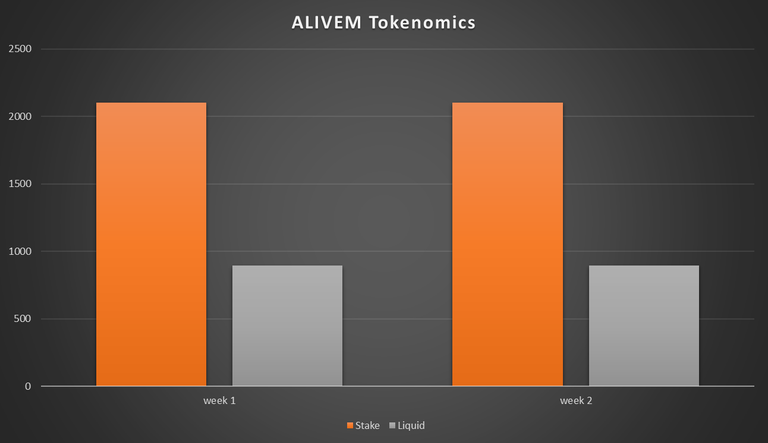
| Supply | Stake | Liquid | Burn | Holders | |
|---|---|---|---|---|---|
| week 1 | 988000 | 2102.636 | 897.364 | 985000 | 1110 |
| week 2 | 988000 | 2103.092 | 896.908 | 985000 | 1115 |
Since Supply and Burn statics have not changed, I remove them from the chart.
Comparing with the previous week, we have increased 0.456 ALIVEM staked, liquid ALIVE decreased -0.456.
| Supply | Stake | Liquid | Burn | Holders | |
|---|---|---|---|---|---|
| week 1 | 0% | 0.16% | -0.38% | 0% | 0% |
| week 2 | 0% | 0.02% | -0.05% | 0% | 0.18% |
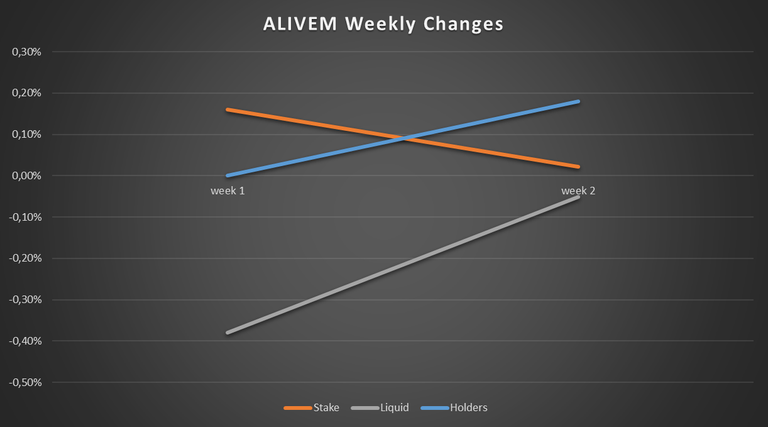
This means our liquid ALIVEM decreased -0.05% and our stake ALIVEM increased 0.02% and our holders increased 0.18%.