It's midweek (almost) and Sunday too, again, so let's see what we're dealing with when it comes to $HIVE $BTC and ETH/BTC, to be ready to make the best decisions next week.

On the weekly time frame, price is still inside the bullish gap (has been for ages) and even though there are still 16 days to go till the candle close, at least the current candle is bullish, and the body of the candle is bigger than the shadows. We'll see when the candle closes at the end of the month.

On the weekly time frame, we got a bounce since last week and have a swing low forming as we speak. As I marked on the chart, a swing low at $0.1916 will be set, if the current candle closes above that level, which is going to happen (potentially), in 15 hours.
In case of bullish continuation, $0.2327 is next on the upside, after which the relative equal lows at $0.2844 and the famous by now $0.3006. If not, $0.1757 is still in the cards and $0.1639 and $0.1467.

On the daily time frame, price made a significant move this week. Since last Sunday, we had 7 bullish candle, followed by (so far) a bearish candle, which is normal. At the time of writing, price is retesting a bullish gap. In case the gap can't defend price, I'm looking at $0.2048 to be swept and if we don't get a bounce there, then there's another bullish gap below, which should defend price. In case that level is lost, I'd watch $0.1956 and $0.1916.
If the current candle closes below $0.2151, we'll have a swing high at that level. In case of a bounce here, the next levels to target on the upside are $0.2188 and $0.2207.

I waited for the h4 candle to close as price looked heavy and was suspecting it's going to close as it has. So at the time of writing, price is still heavy and now it is delivering from a bearish order block (OB). Chances for heading down to $0.2066 are high in my opinion, but we'll see. In case we don't get a bounce here, as I said, $0.2066 is next, after which comes $0.2048.
On the upside, if we get a reversal, I'm looking at $0.2151 and $0.216 to be swept, after which there's the bearish gap, marked with yellow on my chart, which means resistance.
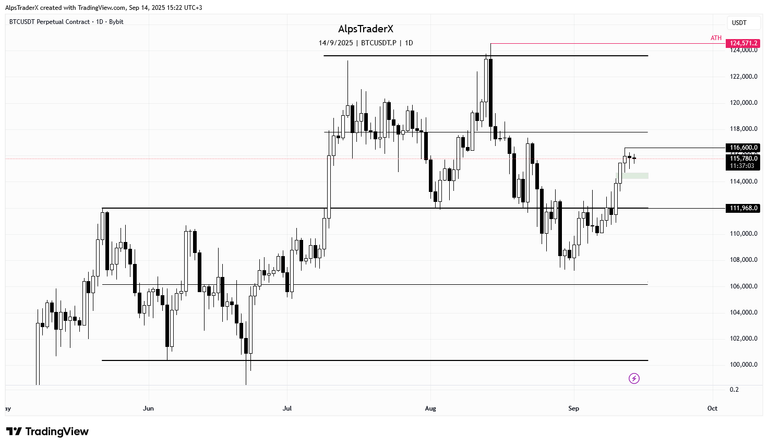
$BTC has made significant progress to the upside this week on the daily time frame. price has managed to climb back into the top range and turn resistance into support. At the time of writing, price lost momentum as it's the weekend, traditional markets are close, many traders are not trading. I'm expecting price to retest the bullish gap between $114,250 and $114,700, marked with green, which should defend price, then bounce off. If the gap doesn't hold, then retest the range low again.

ETH/BTC, the plan (my drawing) is still valid. Price has since retested the OB, which has held price, has rebalanced the bullish gap, and closed above it yesterday. Bullish structure still intact.

As far as the economic calendar is concerned, next week we have three red folder days. Let's see what Powell has to say on Wednesday, then unemployment claims the next day, which is going to be interesting.

I'm usually posting updates on Snaps, keep an eye on it, if you're interested.
Remember, technical analysis is not about forecasting price, but about reacting to what price does.
As always, this is a game of probabilities, not certainties. Also please note, this is not financial advice, it's my view and understanding of the market.
All charts posted here are screenshots from Tradinview.
Come trade with me on Bybit.

If you're a newbie, you may want to check out these guides:
- Communities Explained - Newbie Guide
- Cross Posting And Reposting Explained, Using PeakD
- Hive Is Not For Me
- How To Pump Your Reputation Fast - Newbie Guide
- Tips And Tricks & Useful Hive Tools For Newbies
- More Useful Tools On Hive - Newbie Guide
- Community List And Why It Is Important To Post In The Right Community
- Witnesses And Proposals Explained - Newbie Guide
- To Stake, Or Not To Stake - Newbie Guide
- Tags And Tagging - Newbie Guide
- Newbie Expectations And Reality
- About Dust Vote And Hive Reward Pool, by libertycrypto27