It's time for another technical analysis post as it's Sunday, so let's see what $HIVE and $BTC has been doing and what we can expect next week or the next few days from these two assets and the market in general.
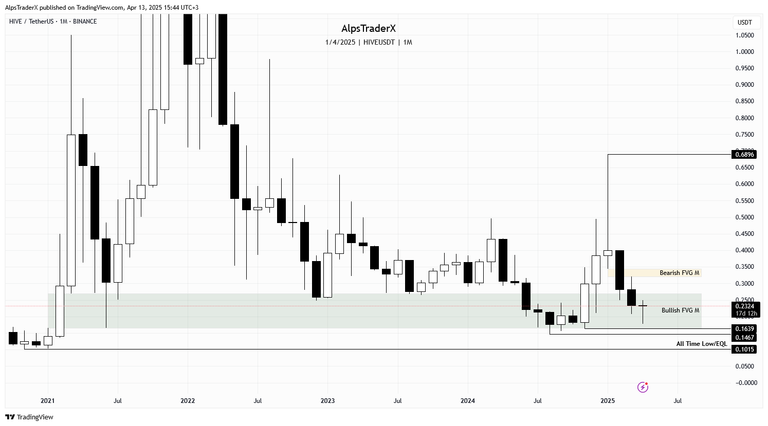
We're nearing to the middle of the month, so there are still more than two weeks till the candle close, but so far, what I can say is that the monthly candle so far looks like a doji, which usually means indecision. Compared to last week, $HIVE is trading a bit higher now and instead a bearish candle, we have a doji, but again, we can't have any conclusion, till the candle is not closed. What I said in my last technical analysis post is still valid.
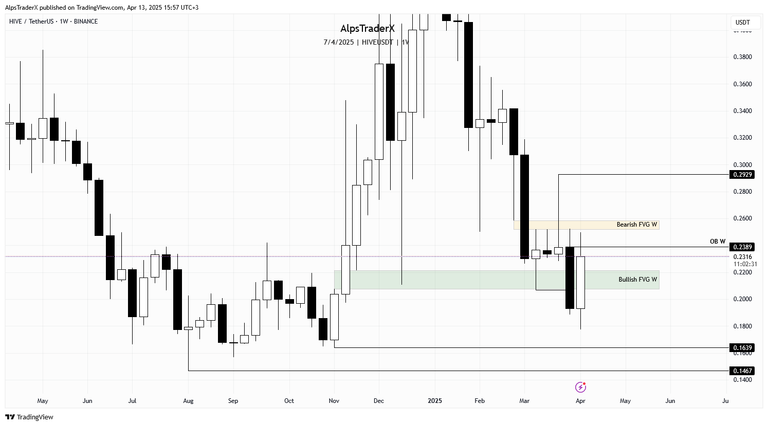
We have an interesting setup on the weekly time frame. The slim bearish fair value gap (FVG) is capping the market at the moment as it rejected price for the third time this week. At the time of writing, the bullish gap (green) is holding price. Interestingly price got close to sweeping $0.2067 this week, but it didn't so far. Chances for getting a bearish engulfing candle this week is pretty high.
What can we expect on the weekly? For bullish continuation, price needs to close above and hold $0.2584, in which case the nest swing high to sweep liquidity above is $0.2929. In case the bullish gap price is in right now can't hold, I'm looking at $0.1639 to be swept, or even $0.1467. from my last post
That's what I wrote last week about the weekly chart. Since then, we have a nice bullish candle this week, which closes in about 11 hours. So far this week's candle shows buyers stepped in and drove price up. For bullish continuation, the current candle needs to close above $0.2389 and make the bearish candle a bullish order block, then invert the bearish gap (marked with yellow on the chart) and hold. If that happens, the next swing high I'm looking to be swept is $0.2929. It's still surprising how that slim bearish gap is capping the market for a month now.
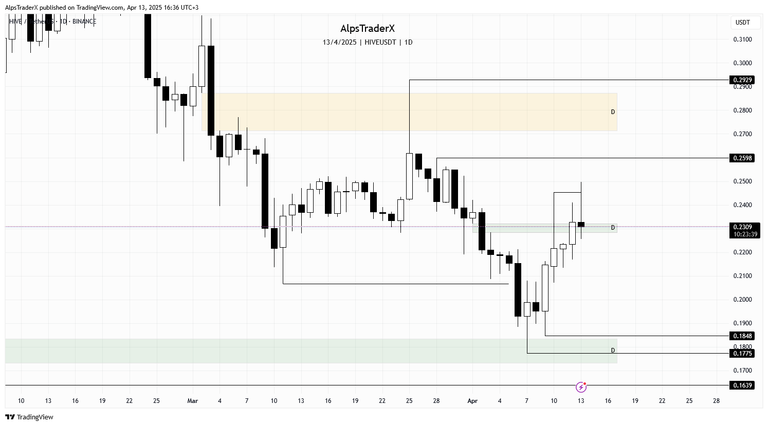
The progress $HIVE made this week is more visible on the daily time frame.
At the time of writing, price is very close to sweeping $0.$2067, which has become a relative equal low in the meantime, as we have a wick at $0.2087. It's just a matter of time, till these lows are going to be swept. The question is, are we going to get a reversal from $0.2067? If not, then I'm looking at the bullish FVG, marked with green on the chart, to be retested next and also to defend price. Worst case scenario is the retest of $0.1639 or even $0.1467, as I mentioned at the monthly time frame. I hope we won't get there, but technical analyses is not about hopes and wishes. I need to stick to what the chart tells me and get ready to have a plan for every scenario. from last week
$0.2087 and $0.$2067 were swept right after I published my post, but we did not get a reversal there. Price wicked down and retested the bullish gap. It bounced back nicely, we must admit, which is always a good thing as it shows buyers stepped in. Last week we had a slim bearish gap on the sell side o the curve, marked with yellow on last week's chart, a gap which since has been inverted and it is retested as we speak. That's the slim green gap now, which should act as support. So far it is holding price, but the daily candle is not closed yet.
In case the gap can defend price, I'm looking at $0.2598 as the nest liquidity pool on the upside. If the gap can't hold price, then there's a chance we're going to revisit $0.1848 and $0.1775.
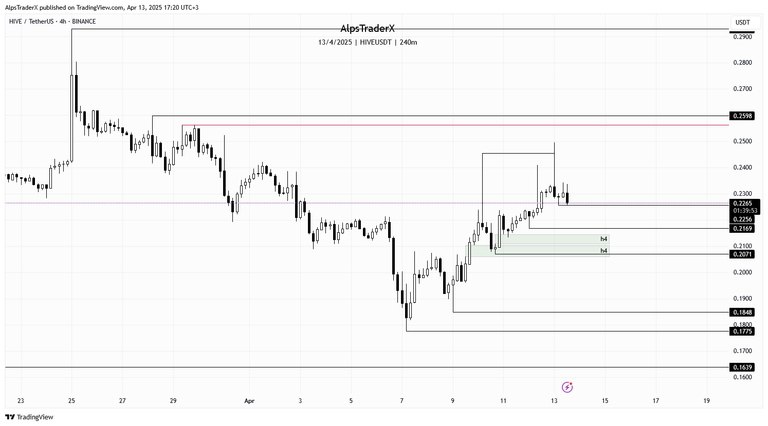
As I always say, on a more granular scale, the h4 time frame shows price swept liquidity above the swing high at $0.2454, but the buying pressure was not enough to keep price at that level, so the candle sweeping the mentioned swing high closed with a long upside wick. Now price is on its way and about to sweep $0.2256, which is now a relative equal low. It's just a matter of time, by the time I finish writing my post, that low will be swept.
In case we don't get a reversal there, which I don't think it's going to happen, I'm looking at $0.2169 and potentially a retest of one or both bullish gaps and in that case sweep of $0.2071.
In case the two bullish gaps can't defend price, there are the two lows marked on my chart, $0.1848 and $0.1775.
Today I decided to spend more time on $BTC and share with you how I see the current situation.
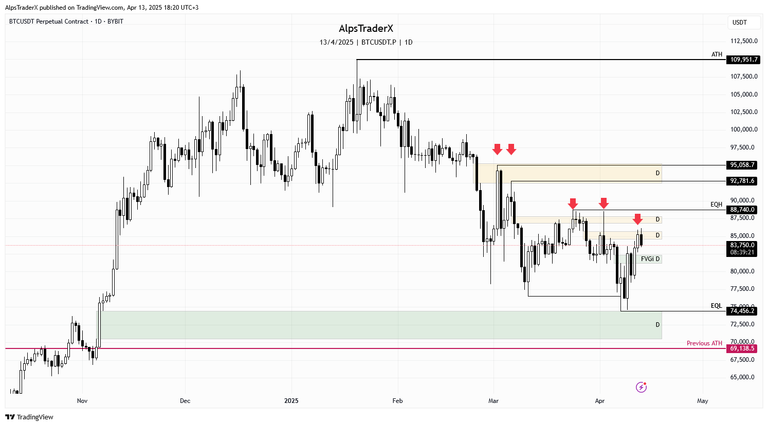
Last Sunday after I posted my analysis, $BTC started to drop like a stone. It was Sunday evening. I posted a chart above for you to see a bigger part of the chart. So basically what happened was $BTC swept liquidity from $76,545, as I mentioned in my post last week.
Looking at the bigger picture, you can see the red arrows on my chart, which means rejection. You see the bearish (yellow) gap, between $95k and $92k, price had two attempt to invert is on 2nd and 3rd of March, then again another attempt on the 6th of March, all failed. Then price created another bearish gap on the 7th, between $87.8k and $86.8k (roughly), which has been capping the market. Price had 5 attempt to invert it, all rejected.
This week price tapped into the bullish gap (green on my chart), created on the 6th of November last year, that has never been rebalanced. It bounced off, then the next day had an attempt to sweep that low, but failed and price shot up and inverted the gap (FVGi D) created last Sunday. That gap is holding price for now, but today price got rejected by the next bearish gap. You can see it marked with yellow on the chart, the lowest I mean.
So what can we expect next week?
We made good progress since the weekly low, which is at $74,456, as $BTC is trading at $83,770 at the time of writing, but we're not out of the woods yet. In case we can get some strength, the next level I'm looking at is the equal highs at $88,770 and then the two swing highs marked on the chart, $92,781 and $95,058.
My concern is those equal lows at $74,456 and the bullish (green) gap below them, which has not been rebalanced. I'm not saying Price is going to revisit these levels now, but it is in the cards and can happen and if it has to, then better now than later.
So I'd be still cautious here.
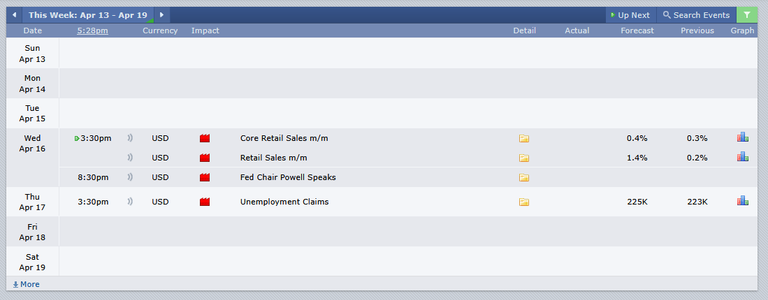
Next week we only have two red folder days, which would mean less volatility, but that only in theory as we know how crazy manipulations can be these days.
Remember, technical analysis is not about forecasting price, but about reacting to what price does.
As always, this is a game of probabilities, not certainties. Also please note, this is not financial advice, it's my view and understanding of the market.
All charts posted here are screenshots from Tradinview.
Come trade with me on Bybit.

If you're a newbie, you may want to check out these guides:
- Communities Explained - Newbie Guide
- Cross Posting And Reposting Explained, Using PeakD
- Hive Is Not For Me
- How To Pump Your Reputation Fast - Newbie Guide
- Tips And Tricks & Useful Hive Tools For Newbies
- More Useful Tools On Hive - Newbie Guide
- Community List And Why It Is Important To Post In The Right Community
- Witnesses And Proposals Explained - Newbie Guide
- To Stake, Or Not To Stake - Newbie Guide
- Tags And Tagging - Newbie Guide
- Newbie Expectations And Reality
- About Dust Vote And Hive Reward Pool, by libertycrypto27