It's Sunday again legends! This means another TA (technical analyses) post is coming, brought to you by yours truly. Let's see what these two assets have been doing lately, shall we?
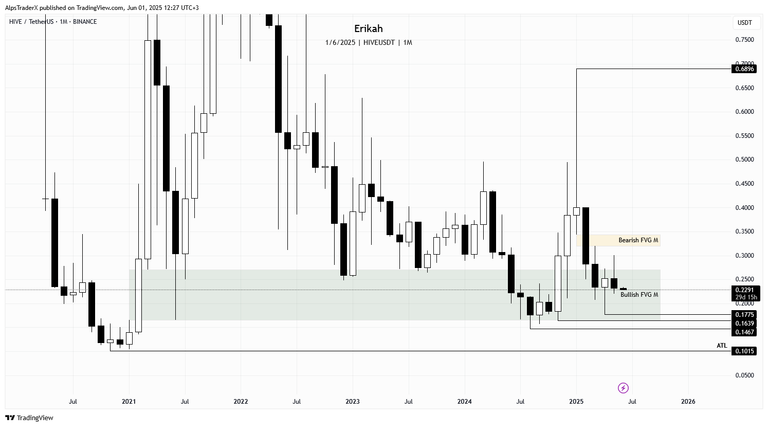
This time we have a clear view of the monthly chart, as the monthly candle closed yesterday. Unfortunately we got a bearish engulfing candle, which may mean more move to the downside. With the current candle close, $0.1775 has been confirmed as swing low now. Price is still inside the bullish gap, which has been holding price for ages.
What can we expect? If there will be more weakness in the market, we can see $0.1775 swept and the lows below it, $0.1639 and $0.1467. On the upside, if price manages to close above the gap ($0.2716) an hold, we have a bearish gap between $0.3410 and $0.3456, which acts as resistance. Close above the gap, hold and the nest liquidity pool is at $0.6896.
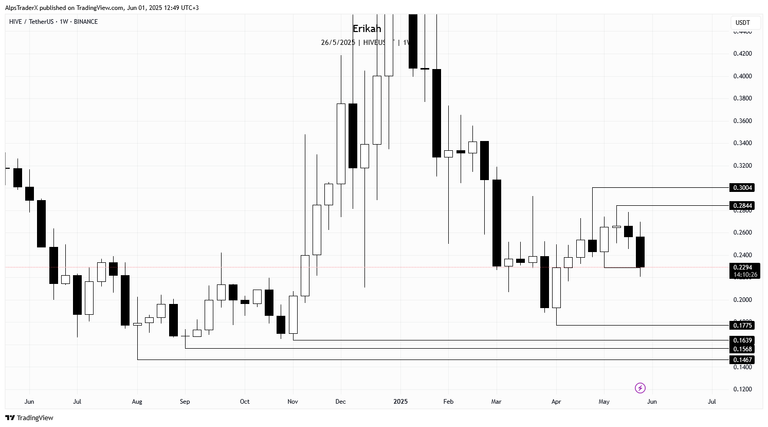
On the weekly chart, this week, although the candle is not closed yer, there are 14 hours till the candle close, we have an ugly bearish candle, which has every chance to confirm a change in state of delivery, if it closes below $0.2429. Price will be delivering from a bearish order block (OB).
At the time of writing, price swept liquidity from the swing low at $0.2285. If we don't see a bounce here, then the lows mentioned above at the monthly analysis are next. In case we see a bounce, the swing high at $0.2844 and $0.3004 are next as liquidity pools.
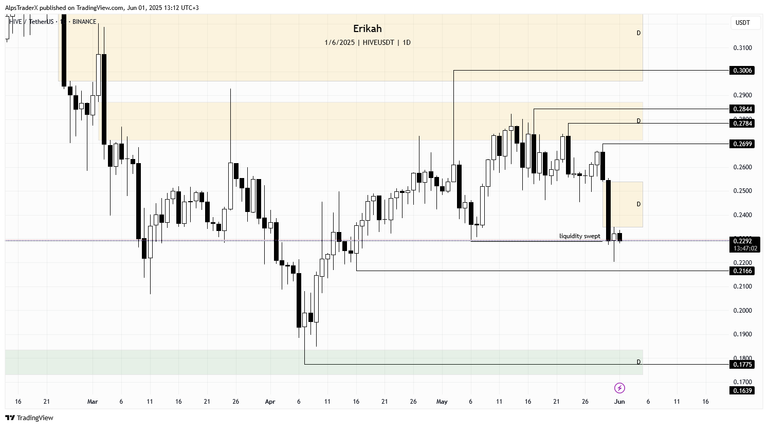
The daily chart shows price is at a crucial level. Swept liquidity from the swing low at $0.2289 and it is below the bearish gap that is capping the market.
Levels I'm watching at the moments are $0.2166 on the downside, which has a real probability to be swept. In order to get a bullish continuation, price need to rebalance, close above and invert the gap, which means price needs to hold above $0.2538. In which case the next liquidity pool to the upside is the swing high at $0.2699, $0.2784 and $0.2844.
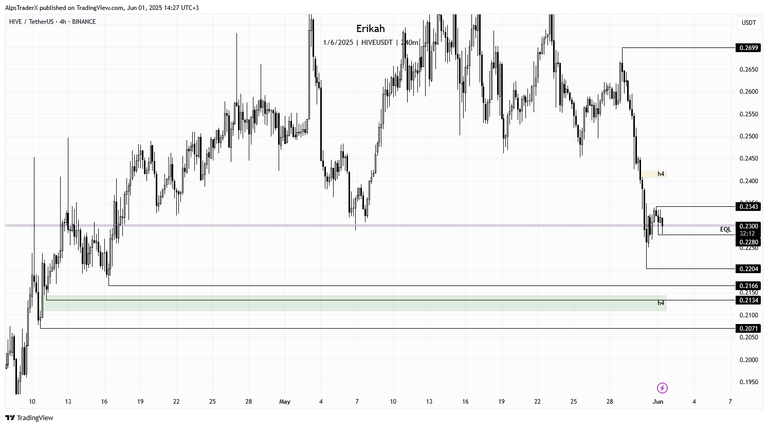
Price on the h4 chart looks heavy and as I see it, chances for price to sweep some more lows are high.
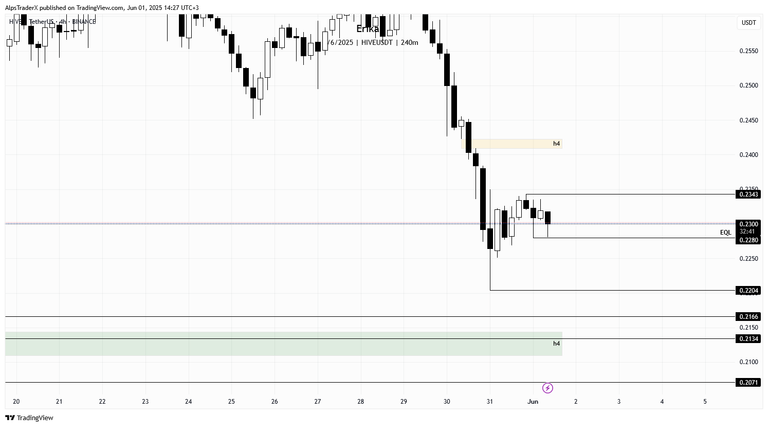
We have relative equal lows at $0.228, which is going to be swept soon in my opinion. Do we go lower? If we do, the levels to watch are $0.2204, $0.2166 and $0.2134, which is a key level. We have a bullish gap there, which should defend price, so we should get a bounce there. If the gap does not hold, the next swing low is at $2071.
On the upside, in case price manages to sweep $0.2343 and hold that level, there's a bearish gap between $0.2409 and $0.2423, which is going to act as resistance. Invert the gap, hold that level and we can see continuation to the upside.
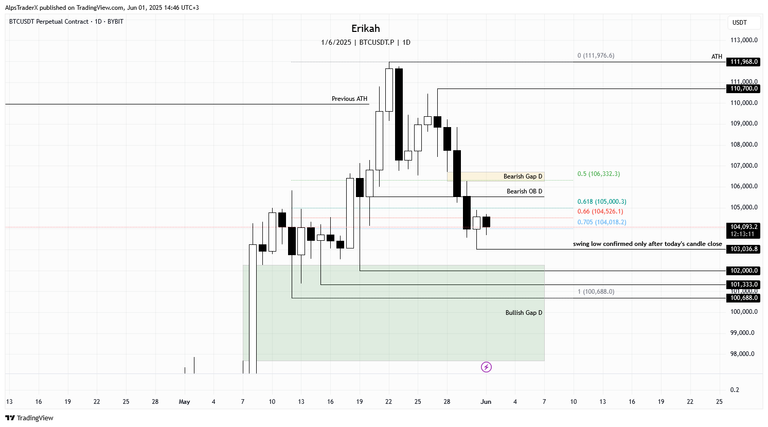
This week I tried to make my daily $BTC report a bit more explicit. I hope it's not confusing. I'm going to try to explain what you are looking at, for those who don't have experience in reading charts.
This week price closed below $105,538, confirming the bearish order block (OB).
If I'm counting my dealing range between $100,688 and $111,976, at the time of writing, price is below mid-range, retesting the golden pocket zone. After today's candle close, the $103,036 low will be confirmed as swing low. In case price continues to be heavy and today's candle closes as a bearish engulfing candle, that's going to make sweeping $103,036 very likely.
In case of more bearish move, the lows I'm looking to be swept are $102,000, $101,333 and $100,686. These levels are inside a bullish gap, which should defend price.
In case price bounces here, for bullish continuation, price needs to invert the bearish gap situating around mid-range, hold that range, and then the next level to be swept is at $110,700 and the current ATH at $111,968.

Next week is going to be interesting, or maybe I should say volatile. We are going to have five red folder days with important data releases, so I'm expecting volatility in the market.
Remember, technical analysis is not about forecasting price, but about reacting to what price does.
As always, this is a game of probabilities, not certainties. Also please note, this is not financial advice, it's my view and understanding of the market.
All charts posted here are screenshots from Tradinview.
Come trade with me on Bybit.

If you're a newbie, you may want to check out these guides:
- Communities Explained - Newbie Guide
- Cross Posting And Reposting Explained, Using PeakD
- Hive Is Not For Me
- How To Pump Your Reputation Fast - Newbie Guide
- Tips And Tricks & Useful Hive Tools For Newbies
- More Useful Tools On Hive - Newbie Guide
- Community List And Why It Is Important To Post In The Right Community
- Witnesses And Proposals Explained - Newbie Guide
- To Stake, Or Not To Stake - Newbie Guide
- Tags And Tagging - Newbie Guide
- Newbie Expectations And Reality
- About Dust Vote And Hive Reward Pool, by libertycrypto27


