I now understand this topic you treated much more better than before now. Hopefully it will be worked upon
You are viewing a single comment's thread from:
I now understand this topic you treated much more better than before now. Hopefully it will be worked upon
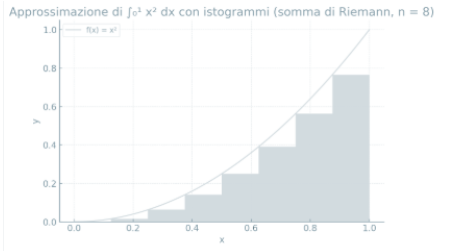
Thank you for your kind words. Quite simply, the integral measures the area under the curve of a graph. Riemann sums with histograms are the most intuitive way to connect the discrete sum to the continuous area. The continuous area is precisely the concept of limit. The more rectangles we increase, the more precise the measurement becomes. Below is a graph created with the AI software Copilot.
!LOLZ
