At first I convinced myself to skip today as it's the first day of Easter and post my usual technical analysis about $HIVE and $BTC tomorrow, but I got myself together and here it is, if you're interested.
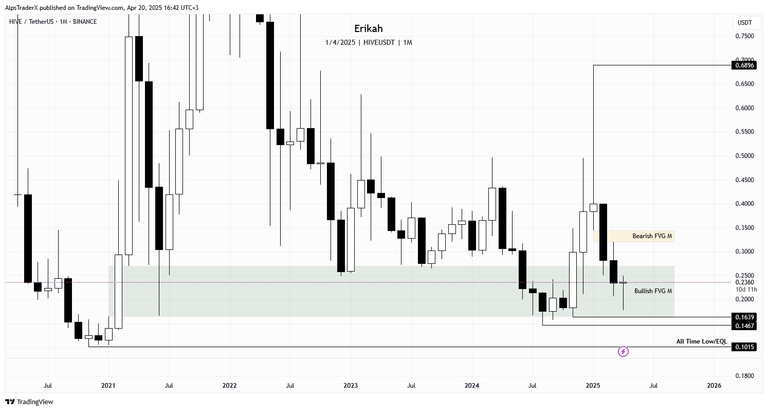
On the monthly time frame, most of what I said in my past post is still valid. What's new today, compared to last week is that instead of a bearish candle, today we have a doji with a long downside wick. Doji candles mean indecision, price could go either way, but the good news is, that long downside wick means buyers stepped in and pushed price up.
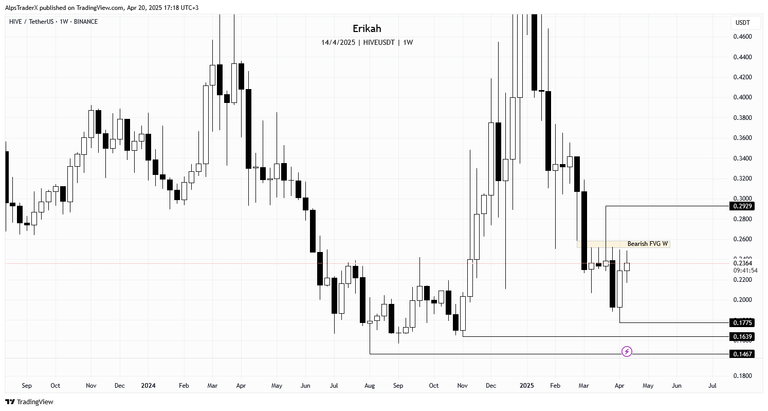
On the weekly time frame, this week's candle, even though it's not closed yet (there are still 10 hours to go till the candle close), it shows price had another attempt to break above the bearish gap (yellow on my chart), but got rejected once again. This is the 5th week when that slim gap is capping the market.
After this week's candle closes, we have a new swing low confirmed at $0.1775, which I would consider as a long entry, in case price shows more weakness. In case price manages to close above and invert the gap, the next level I'm looking at is $0.2929.
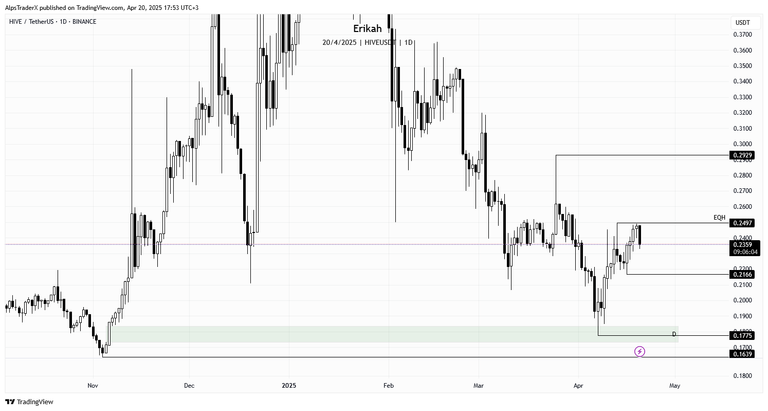
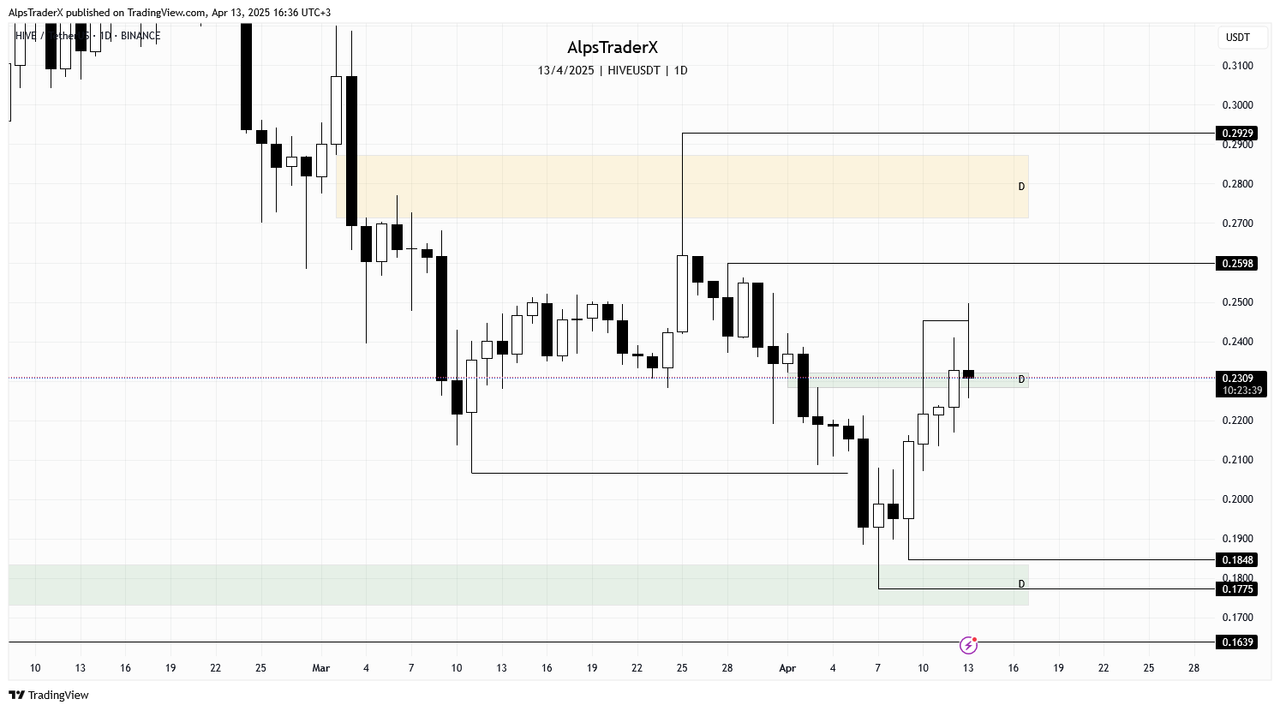
On the daily time frame, price made a nice recovery since the 7th of this month, when price rebalanced half and bounced off the bullish gap. Since last week, price managed to close and hold above the gap I wrote above here. Today's candle closes in 9 hours and if major changes don't happen, we're going to have a bearish engulfing candle.
There are two levels I'm watching, which are the relative equal high (EQH) at $0.2497, this is where price got rejected today, or the next one on the upside is $0.2929.
On the downside, the level price could bounce from is $0.2166, or if there will be weakness, then we can see price going back to $0.1775.
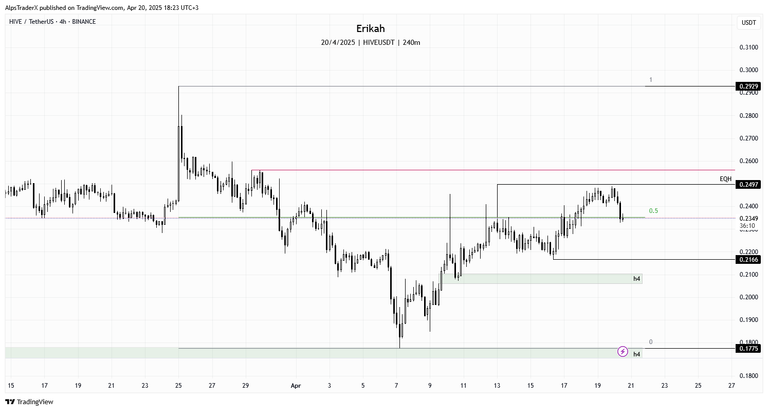
The h4 chart is very clear if I can say so. I like it because we have a pretty balanced price action. There are no gaps on the buy side, except the one between $0.2104 and $0.2058, but it was rebalanced mostly around the 10th of April. The upside is also balanced.
If I take my dealing range from $0.2929 ato $0.1775, at the time of writing, price is retesting mid range and by the look of it, it can go either way, or consolidate a little here, as we have public holiday tomorrow and most of the exchanges are closed. The levels to watch are marked on the chart.

$BTC has been consolidating this week and can't seem to break above the bearish gap that is capping the market. The immediate levels to watch: on the upside there's the equal high at $88,740 and $83,055 on the downside.
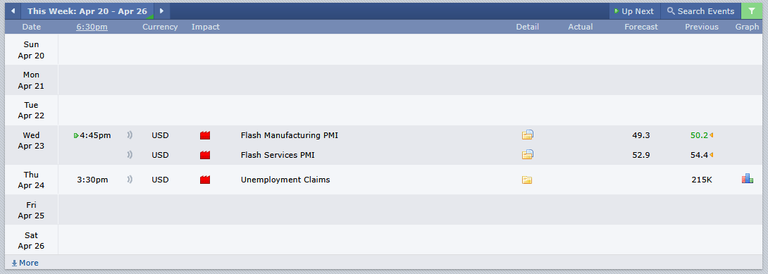
As far as the economic calendar is concerned, next week we only have 2 red folder days, and we don't even have the forecast for the Unemployment Claims. I suppose we're going to have a slightly less volatile week, but we can't be sure of anything in this business, especially with a president who loves to manipulate everyone. The best thing to do is be aware how things stand and have a plan for every situation.
Remember, technical analysis is not about forecasting price, but about reacting to what price does.
As always, this is a game of probabilities, not certainties. Also please note, this is not financial advice, it's my view and understanding of the market.
All charts posted here are screenshots from Tradinview.
Come trade with me on Bybit.

If you're a newbie, you may want to check out these guides:
- Communities Explained - Newbie Guide
- Cross Posting And Reposting Explained, Using PeakD
- Hive Is Not For Me
- How To Pump Your Reputation Fast - Newbie Guide
- Tips And Tricks & Useful Hive Tools For Newbies
- More Useful Tools On Hive - Newbie Guide
- Community List And Why It Is Important To Post In The Right Community
- Witnesses And Proposals Explained - Newbie Guide
- To Stake, Or Not To Stake - Newbie Guide
- Tags And Tagging - Newbie Guide
- Newbie Expectations And Reality
- About Dust Vote And Hive Reward Pool, by libertycrypto27

