I have been a blue member on the X.com (Twitter) platform for a few months now.
Every day has been a new opportunity to interact with more users on X.
This is primarily because the user base of X is huge.
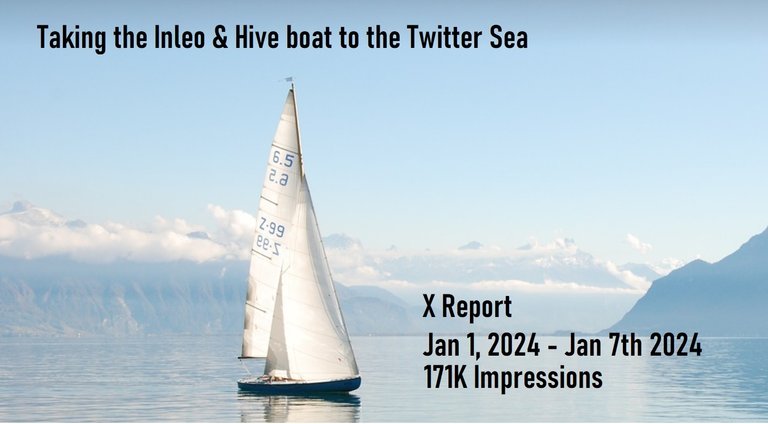
In a lot of ways being active on X is like going to the sea. You can choose to be in a boat or do wave surfing.
The idea of increasing engagement
One way of increasing engagements is to interact with more people and if you want to do this organically then looking for trends can be a starting point.
One you spot a trend emerging, latch on to it and be active there.
If trends were waves
If we draw the analogy of trends to wave in the sea that a surfer can ride then it is up to the surfer to spot a wave that he wants to ride.
When the waves are not strong ...
you can be in a sailboat and let the gentle wind propel you to your destination.
Avoid choppy waters and storms
If you are planning to play for the long run it is best to avoid the controversial stuff that is akin to the storms we experience at sea that can drown both the surfer as well as capsize your boat.
That is my approach towards X I know some people capitalize on tensions, political rumors, political drama and similar stuff however I am not comfortable doing that.
The idea is to ride safely and carry the message of decentralized freedom and free speech that Inleo and Hive offer as the flag bearers of web 3 further.
I am yet to try the speed boat
Using a speed boat would be to use a paid promotion and receive tons of targeted traffic to your content.
I am yet to try this feature so once I do I shall share the experience here.
My X report 1-7th Jan 2024
Impressions matter
My Impressions are down for this week.
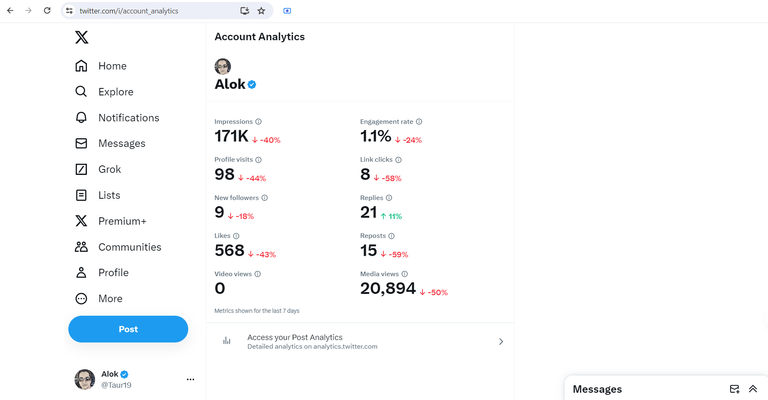
This week my content on twitter received 171K impressions that are down 40% from the week gone by.
The Profile visits are down
My profile received 98 visits and is 44% lower as compared to the previous week.
New followers added
I received 9 new followers this week which is down by 18% as compared to the previous week.
Likes are down from the previous week
At 568 likes that my content received the numbers are 43% lower as compared to previous week.
Engagements to my content
At 1.1% my engagement is down by 24%
My posts received 21 replies which is up by 11%
Reposts took a dip
At 15 reposts that my content received this week the numbers are down by 59%
Media views take a dive
A good way to increase the interaction and retention with users is to have a higher media views.
However this week the media views earned by my content stands at 20,894 which is doen by 50%

source: my X dashboard
My weekly tweet activity
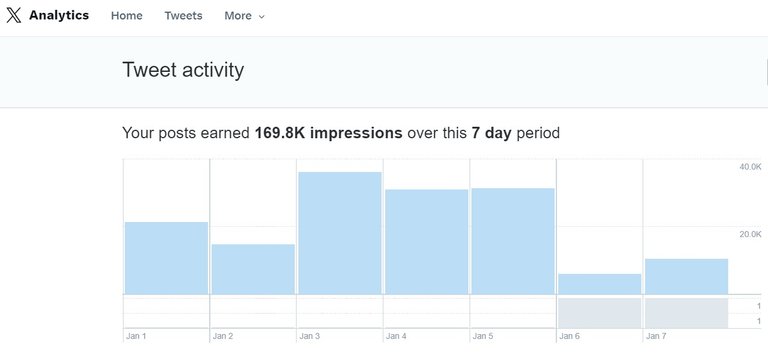
My posts have earned 169.8K impressions in a period of this week spanning January 1st 2024 to January 7th 2024
For the 2nd week in a row Monday has been able to buckle the trend of witnessing a monumental dip.
Instead it is the weekend which witnessed a dip in viewership.
Looking at days from the perspective of weekly average
Not so good days
Tuesday Jan 2nd 2024 received 14,791 views.
Saturday January 6th 2024 witnessed 5999 organic views.
Sunday January 7th received 6101 organic views and is still getting some views at the time of writing this post.
Some better performing days
Monday January 1st 2024 received 21,275 views
Wednesday Jan 3rd 2024 received 36168 views
Thursday Jan 4th 2024 received 30,900 views
Friday Jan 5th 2024 received 31304 views.

source: my X dashboard
The daily average for the seven days
During this week the average views per day stands at 20.9K impressions per day.
Going forward I would continue to navigating the twitter seas and keep increasing the visibility of inleo & Hive so that I can help more users become aware of the Inleo & Hive opportunity.
Currently working on ideas to bring more people onboard Inleo & hive so that they can start their web 3.0 journey
In case you are reading this post from outside inleo/hive then feel free to claim your free hive account using inleo from here
Posted Using InLeo Alpha