Imagine you had a 100-euro bill in 2002. Back then, that 100 euros could buy a lot more than it can today. This is because of something called inflation, which makes prices go up over time. When prices rise, the same amount of money buys fewer goods and services.
How Inflation Works
Inflation is like a slow leak. Over time, it gradually reduces the value of your money. Every year, prices for things like food, fuel, and services increase a little bit. This means you need more euros to buy the same things.
Year-by-Year Breakdown
Here's a simple breakdown of how 100 euros from 2002 have changed in value over the years in Greece:
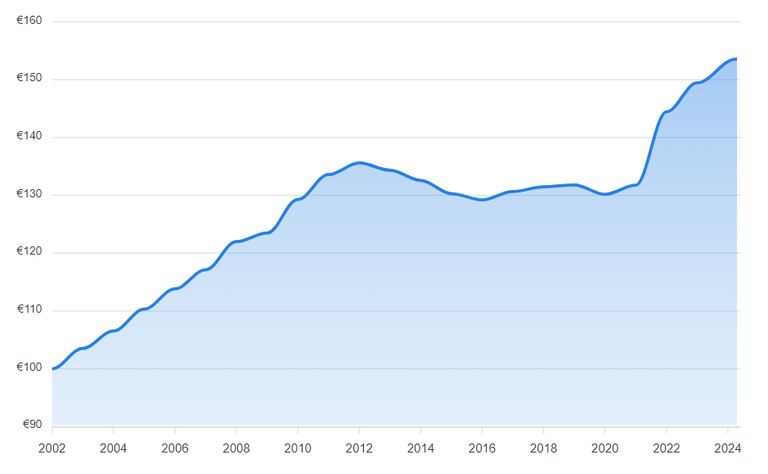
2002: €100.00
2003: €103.53
2004: €106.53
2005: €110.31
2006: €113.83
2007: €117.13
2008: €121.99
2009: €123.47
2010: €129.29
2011: €133.59
2012: €135.60
2013: €134.35
2014: €132.59
2015: €130.29
2016: €129.21
2017: €130.66
2018: €131.48
2019: €131.81
2020: €130.16
2021: €131.76
2022: €144.47
2023: €149.47
2024: €153.95
In 2024, you would need about 154 euros to have the same buying power that 100 euros had in 2002. This means that the value of your 100 euros has decreased significantly over the past 22 years
Let's look at some everyday items and how their prices have increased:
Bread:
2002: €0.80 per loaf
2024: €1.23 per loaf
Milk (1 liter):
2002: €0.92
2024: €1.45
Eggs (12 pack):
2002: €1.50
2024: €2.30
Gasoline (per liter):
2002: €0.85
2024: €1.95
The Impact on Daily Life
Back in 2002, you could go to the grocery store with 100 euros and fill your cart with a lot of essentials. Today, that same 100 euros would get you much less. For instance:
In 2002, 100 euros might buy you enough groceries for a week.
In 2024, the same groceries might cost you around 154 euros.
This means that over the years, you've needed more money to buy the same things. This is why saving money in a piggy bank isn't enough; you need to invest it wisely to keep up with inflation.
But let's see why this is even worse in a country like Greece.
Average Wages in Greece (2002-2024)
Tracking average wages gives additional context to the changes in purchasing power. According to data from the OECD, here's an overview of the average annual wages in Greece from 2002 to 2024, adjusted for inflation to 2022 constant prices:
2002: €18,551
2008: €22,240
2012: €20,672
2015: €18,300
2020: €17,220
2024: €16,174 (projected)
Annual Changes
2002-2008: Wages increased by about 20%, reflecting economic growth pre-crisis.
2008-2012: A decrease of around 7%, as the crisis took hold.
2012-2015: A further decline of about 11%, due to austerity measures.
2015-2020: Stabilization, but at a much lower level than pre-crisis.
2020-2024: Modest improvement, but wages are still significantly lower than in 2008.
From 2002 to 2024, inflation in Greece has significantly eroded the value of 100 euros. To maintain the same purchasing power as 100 euros in 2002, you would need approximately 154 euros in 2024. This represents a 54% increase in the amount of money required to buy the same goods and services. At the same time, the average wage in Greece has decreased, exacerbating the financial strain on individuals. For example, the average annual wage adjusted for inflation was about €18,551 in 2002 but has dropped to approximately €16,174 in 2024. This dual effect of rising prices and declining wages highlights the economic challenges faced by Greeks over the past two decades.
https://stats.oecd.org/Index.aspx?DataSetCode=AV_AN_WAGE
https://data.oecd.org/greece.htm
https://stats.oecd.org/viewhtml.aspx?datasetcode=AV_AN_WAGE&lang=en
https://www.inflationtool.com/euro-greece/2002-to-present-value
Posted Using InLeo Alpha


