After my first TA post's feedback, I decided to give these posts a go. I'm not saying I'm going to do this every Sunday without exception, but as long as people enjoy it, I'm going to do my best to share my thoughts on our native token. So let's start with the monthly chart as the month is ending next week.
This is my last week's report, you can check the evolution of $HIVE price if you missed it.
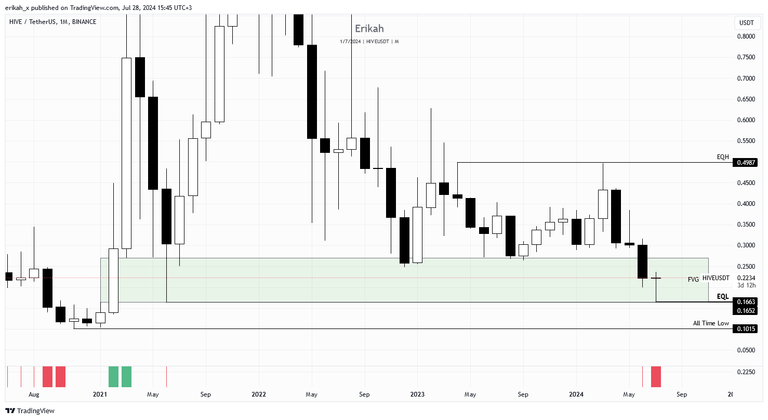
The monthly chart is really interesting. Again, there are three more days (plus this one), till the candle close, but right now price is inside a bullish Fair Value Gap (FVG). The monthly bias is bullish, till price manages to close outside the bullish FVG. If price closes below the FVG, it turns bearish and I'm expecting to sweep those equal lows marked on the chart. The upside is a bit more complex. Should price close like it is now, it can create a bearish FVG, which then would act as resistance. Should price close above the bullish (green) FVG, I'm expecting a bullish continuation.
The candle we're getting now on the monthly chart looks like a dragonfly doji candle. The missing body of the candle indicates indecision. The candle has a long downside wick, that indicates selling, which was absorbed successfully and push price where it is now. This candle comes after three consecutive bearish candles, it can signal a reversal, but we need to wait till the candle closes and next month a bullish candle to confirm that.
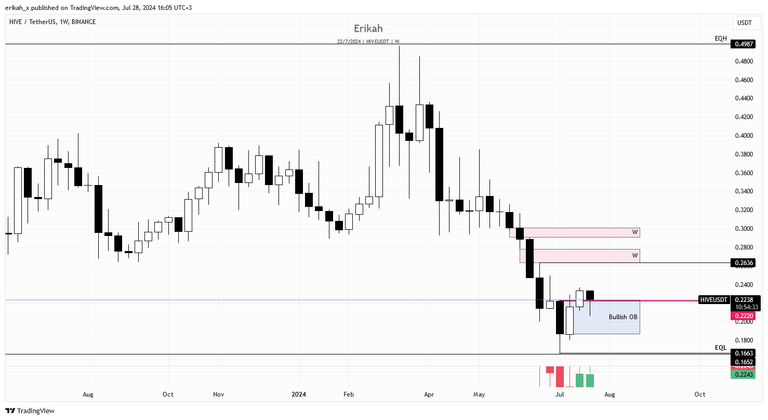
On a weekly scale, you can see, last week's candle closed above the pink line, at $0.222 and confirmed the bullish order bloc (OB). Although this week's candle is not closed yet, there ate still about eight hours till that happens, and even though this week's candle is a bearish one so far, at the moment of writing price is still above the bullish OB, which is acting as support. As long as price remains above the bullish OB (FVG marked with blue on the chart), we can expect bullish continuation. There are two bearish FVGs on the sell side of the curve, the first one at $0.2636, which can act as resistance. Should price close above both of them, I'm expecting a bullish continuation and price can look for liquidity at the level of $0.3852. But remember, this is a weekly scale, it takes time for price to reach that level. For those of you who are not familiar with these charts, one candle is printed in one week, so each candle means one week. In case the bullish OB does not hold, I'm expecting price to seek liquidity lower and sweep the equal lows at $0.1652.
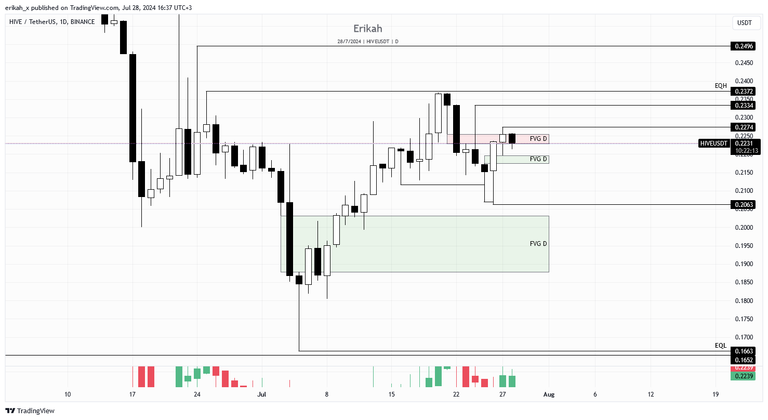
On a daily scale, price currently is inside a bearish FVG, marked with red. Should price close below the bearish FVG, I'm expecting the bullish (green) FVG below to hold. If that bullish FVG doesn't hold price, then there's a possibility for price to seek liquidity below the bullish candle's wick at $0.2063. Should price close above the bearish FVG, the next liquidity pools are above $0.2274, $0.2334 and at the equal highs at $0.2372 and above.
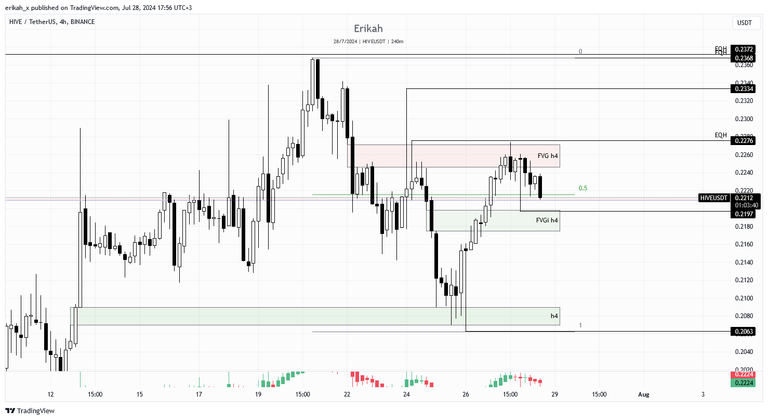
The h4 chart looks good. We had some nice moves both direction. We had an upside candle with a huge wick on the 24th, that swept liquidity, rebalanced the bearish FVG, but closed below the FVG at the end. The next candle also had a nice upside wick, but could not close above the bearish FVG. Right now that red, bearish FVG is capping the market. There were several attempts, price tried to invert it, but without any success.
There's a bullish, inverted FVG below, which price bounced off of yesterday. Right now price is sandwiched between the two FVG and is right at the mid-line of the dealing range. There's still 1h to go till the candle close, so we don't know for sure, but right now it looks like a bearish engulfing candle. I suppose we're going lower, but we don't deal with suppositions, we deal with facts, so let's wait till the candle close. Would be nice to see a retest of the inverted FVG, then bullish continuation to the upside. If the FVGi can't hold price, I'm expecting a retest of the other bullish FVG lower, and the sweep of the $0.2063 low.
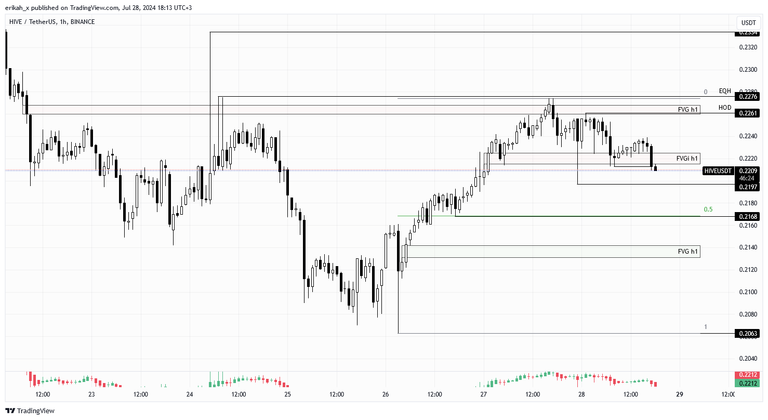
The h1 chart is more clear. Unfortunately the last candle closed below the FVG, inverting it, which means the FVG is serves now as resistance. Chances are price sweeps $0.2197, or the low at $0.2168. I wouldn't mind a quick wick to $0.2063, but there's still a long way there.
This week was pretty eventful. Right after I published my post last Sunday, President Biden announced his withdrawal from the next presidential campaign. This is bullish news for crypto.
Yesterday Donald Trump spoke in Nashville at the BTC Conference. He said pretty much what the crypto community wanted to hear, all bullish news of course, but market makers used the occasion to grant themselves some cheap entry. The $0.2197 wick you see on the last $HIVE chart was printed during the speech.
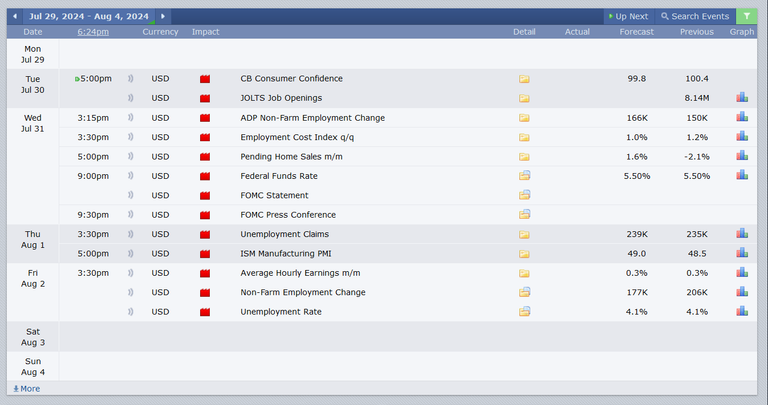
Next week we have four red folder days, among which FOMC and Unemployment Claims, volatility is expected, which is going to influence Hive to some extent as well, so stay safe.
Please note, this is not financial advice! It is how I see the market at the moment.
All charts posted here are screenshots from Tradinview.
Later Edit: looks like there's always something that happens after I post my analysis :)
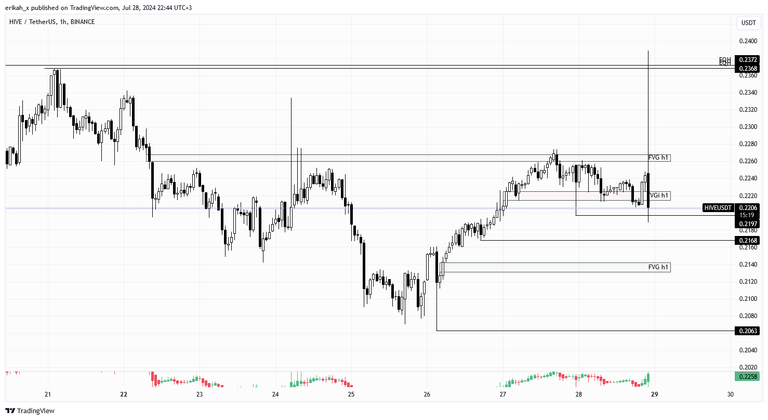
This candle came out of nowhere and swept both high and low. We call these scam wicks, but on Hive it's just a big order. Big in terms of $HIVE I mean.

If you're a newbie, you may want to check out these guides:
- Communities Explained - Newbie Guide
- Cross Posting And Reposting Explained, Using PeakD
- Hive Is Not For Me
- How To Pump Your Reputation Fast - Newbie Guide
- Tips And Tricks & Useful Hive Tools For Newbies
- More Useful Tools On Hive - Newbie Guide
- Community List And Why It Is Important To Post In The Right Community
- Witnesses And Proposals Explained - Newbie Guide
- To Stake, Or Not To Stake - Newbie Guide
- Tags And Tagging - Newbie Guide
- Newbie Expectations And Reality
- About Dust Vote And Hive Reward Pool, by libertycrypto27

