It's time for another $HIVE TA post so let's see what we have today.
During the week I was hoping today I will see a white candle on the monthly chart, but my wishes don't count as the chart shows.
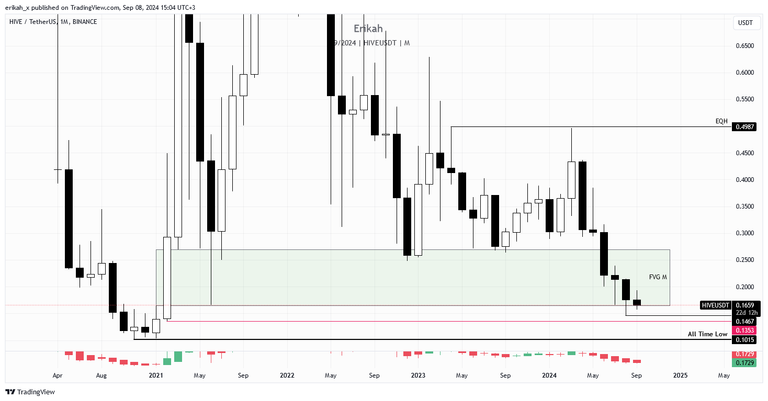
In my last week's post the monthly candle was bullish at the time of writing, but I need to mention, it was the 1st of the month, with only a few hours passed of the month. It's been a week since then and we have six consecutive bearish candles so far. The bullish (green) fair value gap (FVG) has been totally rebalanced (last month) and the current candle is sitting at the bottom of it. If the candle closes below the FVG, that means an inversion and this FVG becomes a bearish one and will serve as resistance. In that case, chances are, price is going to seek liquidity lower, targeting $0.1355 or the all time low (ATL) at $0.1015. Will that happen? No one knows, we can just hope it won't.
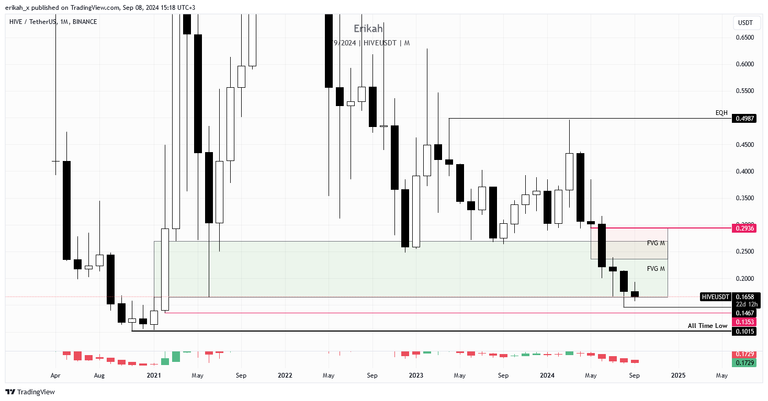
The plan for bullish continuation remains the same, price needs to get back to $0.2936, hold that level and continue t the upside. This is the monthly chart, which means one candle is written in one month, so such a move requires time as we're talking about a 77% move to the upside, from where we are now. It's not impossible, nothing is in this life, but quite unlikely to happen on three weeks.
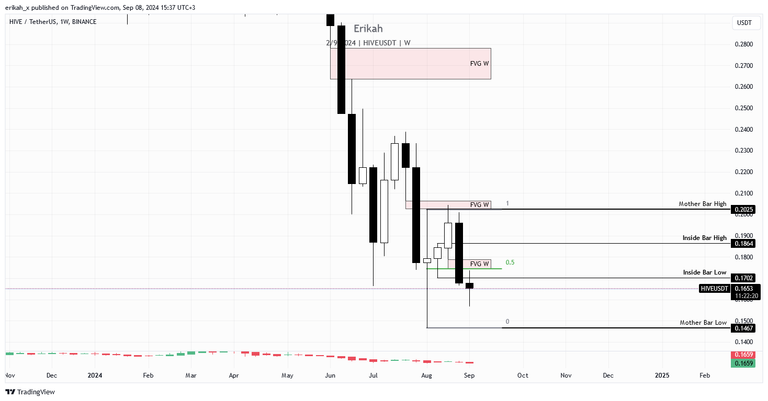
I'm a liquidity based trader, not a pattern trader, but there's one pattern that I use in my TA and that's the inside bar pattern. We have a nice one here on the weekly and price right now is below the inside bar low and below the midline of the mother bar as well, which means it's more bearish than bullish. There are roughly 11 hours till the candle close, but so far it looks like we're going to have a bearish FVG (marked with red) on the weekly, which serves as resistance. In other words, price needs to close above the FVG and hold $0.1789 level. Maybe next week.
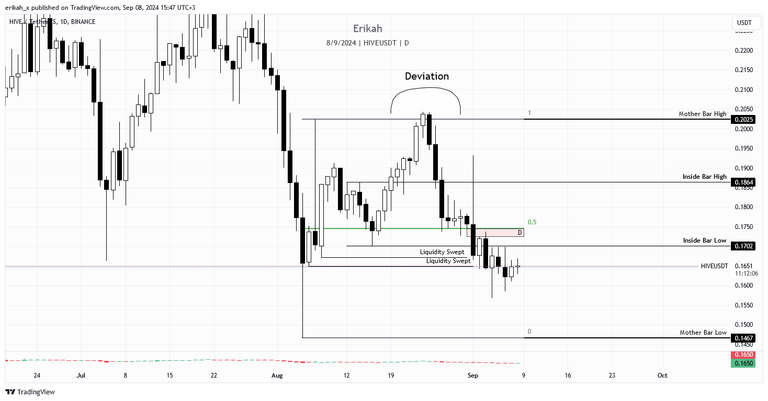
The daily chart looks a bit better in my eyes. I left the inside bar pattern on the chart, to show you the attempt of a breakout, which later proved to be just a deviation as price came back the inside the range.
Price swept liquidity on the downside and printed a bullish engulfing candle yesterday, which usually means bullish continuation. The candle we have today so far looks like a doji, with no body, which indicates indecision, but the day is not over yet, so the candle can definitely look different at the end of the day. I marked the daily bearish FVG with red on the chart, which is sitting right below the midline of the mother bar, which means, if price manages to close above the level $0.1747, then we can expect continuation to the upside.
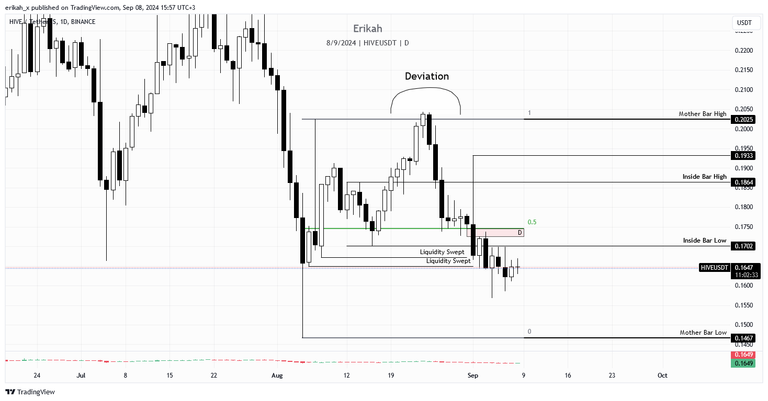
If price manages to invert that bearish FVG, then there's nothing to stop price till the top of that big upside wick at $0.1933. But then again, Hive is a different animal and as it's not a very liquid asset, a big order can blow up everything.
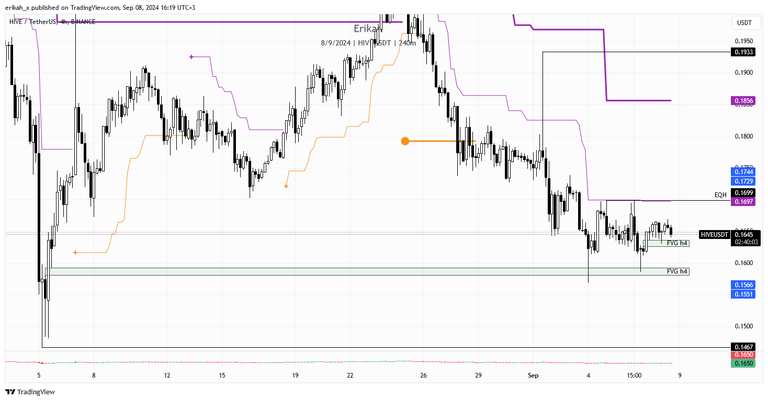
The h4 chart looks like a small consolidation this week. We have a bullish fair value gap (green box) at the $0.1581 - $0.1592 area, which was tested this week on Wednesday and rebalanced. Then it was tested again on Friday and as you can see, it's holding price nicely.
I left the indicator on so you can see, price is below both the current timeframe trendline (thin purple line), which is h4 and the high timeframe trendline as well, (thick purple line), which is the daily. There's a long way to bet back above both.
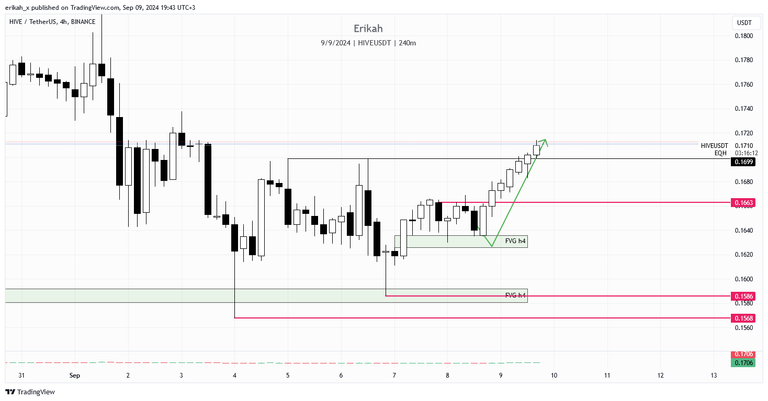
Zooming in, you can see another bullish FVG on the chart, which was tested this morning and price bounced off of it nicely, but there was another FVG, a slim one (marked with red) right after the bounce, which could not hold price and it is now a bearish FVG, serving as resistance. I marked a possible scenario on the chart with a green arrow. In case price can close above the dark pink like, which is the top of the bearish order block, we can expect continuation to the upside, especially that we have equal highs at the $0.1699 level, which is in confluence with the current timeframe trendline.
Correction: the slim FVG I mention above is in fact bullish and should be marked with green as the candle was not closed at the time of writing. My mistake. Right now there's one hour till the candle close and unless it closes below, the FVG remains bullish.
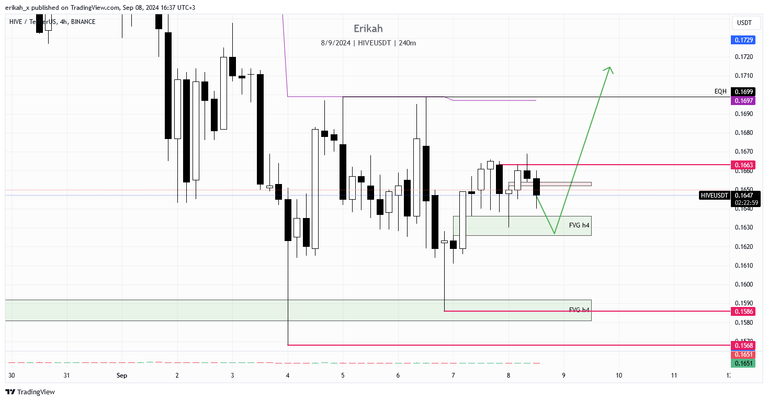
If the green box (bullish FVG) can't defend price, chances are price could sweep the two lows marked with dark pink on the chart, at $0.1586 and the next below at $0.1568.
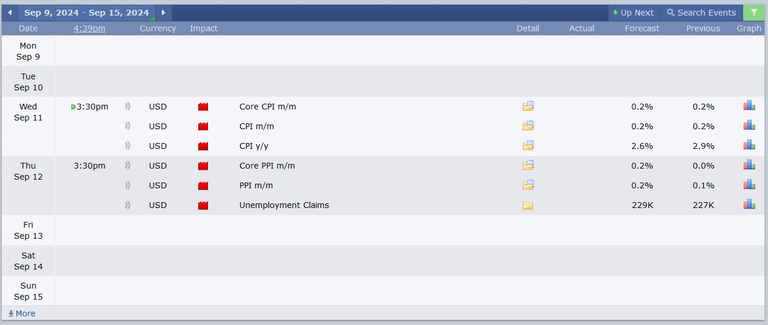
I can't finish my analysis without mentioning what to expect next week. The economic calendar is not as heavy next week as we only have two days of red folder news, but those two days will be like a real roller coaster ride as the data is important and has huge impact on every market. Let's see if they will miss these by a mile as it happens, which gives room to huge manipulation of the markets.
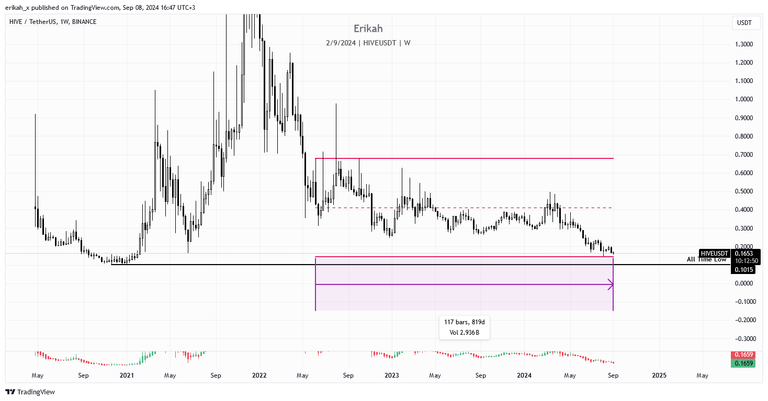
At the end I'd like to say a few words, my opinion based on where we stand right now.
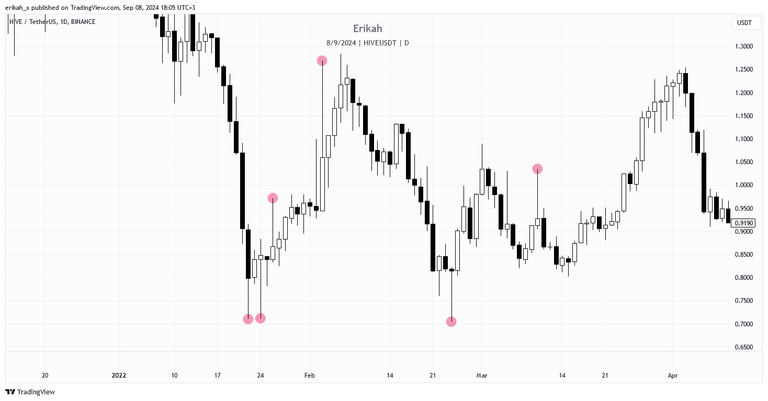
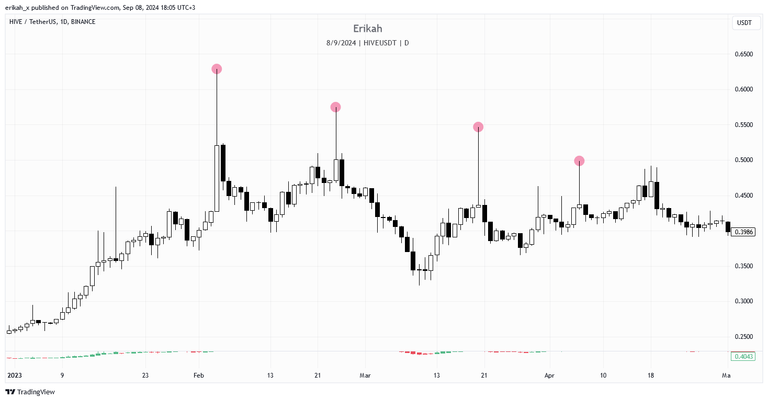
The chart about is not technical analyses, it's just common sense, that should make sense to everyone, even if you have no clue about trading or tape reading in general. I drew a channel on the chart, which basically should mean a period of accumulation. That is a period or more than two years, in which $HIVE was moving between $0.1474 and $0.679, but at a closer look, you can see price was mostly hovering below $0.41.
I haven't been as active on Hive as before, but I still keep an eye on posts and can still see people calling for $0.1. Are we going to get there? There's no way to know. They don't know either, at this point it's pure speculation in hope of being right, then brag about it. No one can predict the bottom and those who claim they can, are just lucky.
Well, accumulation doesn't mean buying the exact bottom. It means DCA-ing in (dollar cost averaging) slowly. You can earn your stake on the platform, and/or you can buy it, up to you which one you choose, but make sure you don't miss the opportunity. If 2 years is not enough to accumulate, then ... I don't know what more I can say.
As always, this is a game of probabilities, not certainties. Also please note, this is not financial advice, it's my view and understanding of the market.
All charts posted here are screenshots from Tradinview.

If you're a newbie, you may want to check out these guides:
- Communities Explained - Newbie Guide
- Cross Posting And Reposting Explained, Using PeakD
- Hive Is Not For Me
- How To Pump Your Reputation Fast - Newbie Guide
- Tips And Tricks & Useful Hive Tools For Newbies
- More Useful Tools On Hive - Newbie Guide
- Community List And Why It Is Important To Post In The Right Community
- Witnesses And Proposals Explained - Newbie Guide
- To Stake, Or Not To Stake - Newbie Guide
- Tags And Tagging - Newbie Guide
- Newbie Expectations And Reality
- About Dust Vote And Hive Reward Pool, by libertycrypto27

