~~~ La versione in italiano inizia subito dopo la versione in inglese ~~~
ENGLISH
31-01-2025 - Computer science basics - Matlab, graphs (02) [EN]-[IT]
With this post I would like to give a brief instruction regarding the topic mentioned in the subject
(code notes: X_52)
Matlab, graphs (02)
Matlab, in addition to being a suitable tool for doing matrix calculations and algebraic calculations, can also be used for the construction of graphs.
2D graphs
With matlab you can generate various two-dimensional graphs. Below is a list of the features related to 2D graphs
-Line plot (plot): Graph of one or more curves on a Cartesian plane.
-Scatter plot (scatter): Scatter plot to represent points with coordinates (x, y).
-Bar chart (bar, barh): Bar graph (vertical or horizontal).
-Histogram (histogram): Graph of frequencies.
-Pie chart (pie): Pie chart.
-Stem plot (stem): Graph with vertical lines and markers.
-Area plot (area): Shows filled areas under a curve.
3D graphs
One of the special features of Matlab is the creation of 3D graphs.
Below is a list of the features related to three-dimensional graphs.
-3D plot (plot3): 3D graph for curves in space (x, y, z).
-Surface plot (surf, mesh): Three-dimensional surfaces with z values depending on (x, y).
-Contour plot (contour, contour3): Contour lines in 2D or 3D.
-Scatter 3D (scatter3): Scatter plot in three-dimensional space.
-Bar 3D (bar3): 3D bar graphs.
-Volume visualization (slice, isosurface): Visualization of volumetric data.
Specialized graphs
You can also create very special graphs that are called specialized graphs.
-Polar plot (polarplot): Graphs in polar coordinates.
-Geoplot (geoplot): Geographic graphs based on coordinates (latitude/longitude).
-Logarithmic plots (semilogx, semilogy, loglog): Graphs with logarithmic scales.
-Box plot (boxplot): Statistical distribution of data.
-Error bar plot (errorbar): Graphs with error bars.
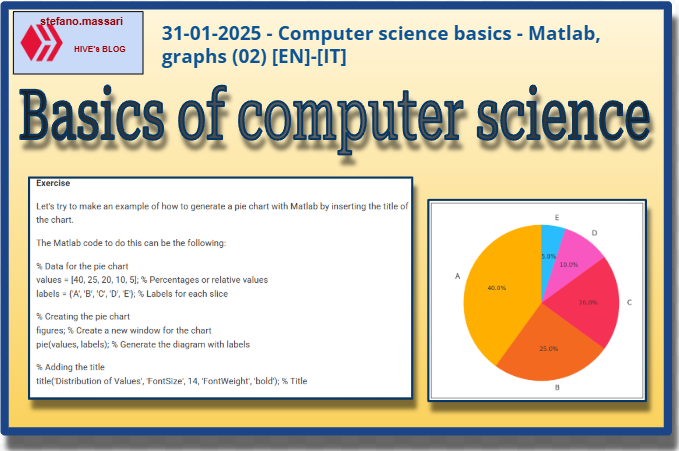
Exercise
Let's try to make an example of how to generate a pie chart with Matlab by inserting the title of the chart.
The Matlab code to do this can be the following:
% Data for the pie chart
values = [40, 25, 20, 10, 5]; % Percentages or relative values
labels = {'A', 'B', 'C', 'D', 'E'}; % Labels for each slice
% Creating the pie chart
figures; % Create a new window for the chart
pie(values, labels); % Generate the diagram with labels
% Adding the title
title('Distribution of Values', 'FontSize', 14, 'FontWeight', 'bold'); % Title
Code Analysis
values: Contains the data to display in the chart.
labels: Specifies the labels for each slice.
pie: Creates the pie chart with labels.
title: Adds only the title without managing any axis.
Code Description
step 1
Define the data to be represented
values = [40, 25, 20, 10, 5];
labels = {'A', 'B', 'C', 'D', 'E'};
step 2
Create the chart window with the figure command;
step 3
Creating the pie chart with the command pie(values, labels);
pie creates the pie diagram taking as input the values to be represented and the labels for each slice.
step 4
Adding the title with the command title
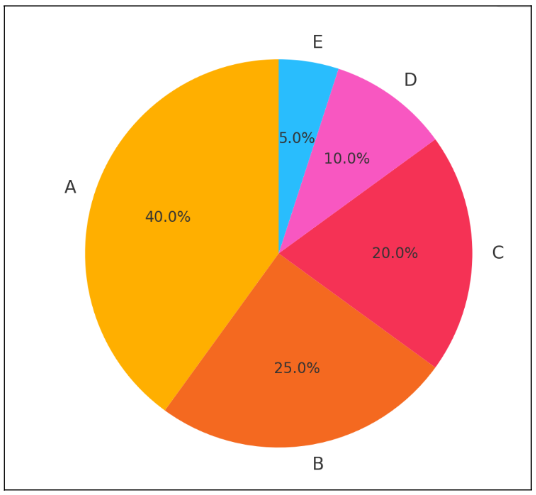
Final output
Matlab will show us a pie diagram divided into 5 parts proportional to the defined values.
Conclusions
MATLAB is an excellent tool for scientific calculation and data processing. Among its main strengths, the ability to create high-quality graphs and visualizations in an intuitive and efficient way stands out. Thanks to its features, MATLAB allows you to generate both two-dimensional and three-dimensional graphic representations.
Question
Have any of you already tried to make graphs with Excel? And with Matlab have you ever tried?
![]()
[ITALIAN]
31-01-2025 - Basi di informatica - Matlab, grafici (02) [EN]-[IT]
Con questo post vorrei dare una breve istruzione a riguardo dell’argomento citato in oggetto
(code notes: X_52)
Matlab, grafici (02)
Matlab, oltre ad essere uno strumento adatto per fare calcoli con matrici e calcoli algebrici, può essere usato anche per la costruzione di grafici.
Grafici 2D
Con matlab si possono generare diversi grafici bidimensionali. Qui di seguito un elenco delle funzionalità legate ai grafici 2D
-Line plot (plot): Grafico di una o più curve su un piano cartesiano.
-Scatter plot (scatter): Grafico a dispersione per rappresentare punti con coordinate (x, y).
-Bar chart (bar, barh): Grafico a barre (verticali o orizzontali).
-Histogram (histogram): Grafico delle frequenze.
-Pie chart (pie): Grafico a torta.
-Stem plot (stem): Grafico con linee verticali e marcatori.
-Area plot (area): Mostra aree riempite sotto una curva.
Grafici 3D
Una delle particolarità di Matlab è la creazione di grafici 3D.
Qui di seguito un elenco delle funzionalità legate ai grafici tridimensionali.
-Plot 3D (plot3): Grafico 3D per curve nello spazio (x, y, z).
-Surface plot (surf, mesh): Superfici tridimensionali con valori z dipendenti da (x, y).
-Contour plot (contour, contour3): Curve di livello in 2D o 3D.
-Scatter 3D (scatter3): Grafico a dispersione nello spazio tridimensionale.
-Bar 3D (bar3): Grafici a barre 3D.
-Volume visualization (slice, isosurface): Visualizzazione di dati volumetrici.
Grafici specializzati
Si possono creare anche dei grafici molto particolari che vengono chiamati, grafici specializzati.
-Polar plot (polarplot): Grafici in coordinate polari.
-Geoplot (geoplot): Grafici geografici basati su coordinate (latitudine/longitudine).
-Logarithmic plots (semilogx, semilogy, loglog): Grafici con scale logaritmiche.
-Box plot (boxplot): Distribuzione statistica dei dati.
-Error bar plot (errorbar): Grafici con barre di errore.
Esercizio
Proviamo a fare un esempio di come per generare un diagramma a torta con Matlab inserendo il titolo del grafico.
Il codice Matlab per fare questo può essere il seguente:
% Dati per il diagramma a torta
valori = [40, 25, 20, 10, 5]; % Percentuali o valori relativi
etichette = {'A', 'B', 'C', 'D', 'E'}; % Etichette per ciascuna fetta
% Creazione del grafico a torta
figure; % Crea una nuova finestra per il grafico
pie(valori, etichette); % Genera il diagramma con le etichette
% Aggiunta del titolo
title('Distribuzione dei Valori', 'FontSize', 14, 'FontWeight', 'bold'); % Titolo
Analisi del codice
valori: Contiene i dati da visualizzare nel grafico.
etichette: Specifica le etichette di ciascuna fetta.
pie: Crea il diagramma a torta con etichette.
title: Aggiunge solo il titolo senza gestire alcun asse.
Descrizione del codice
passo 1
Si definiscono i dati da rappresentare
valori = [40, 25, 20, 10, 5];
etichette = {'A', 'B', 'C', 'D', 'E'};
passo 2
Creazione della finestra del grafico con il comando figure;
passo 3
Creazione del grafico a torta con il comando pie(valori, etichette);
pie crea il diagramma a torta prendendo in ingresso i valori da rappresentare e le etichette per ciascuna fetta.
passo 4
Aggiunta del titolo con il comando title
Output finale
Matlab ci mostrerà un diagramma a torta suddiviso in 5 parti proporzionali ai valori definiti.
Conclusioni
MATLAB è un ottimo strumento per il calcolo scientifico e l’elaborazione dei dati. Tra i suoi principali punti di forza, spicca la capacità di creare grafici e visualizzazioni di alta qualità in modo intuitivo ed efficiente. Grazie alle sue funzionalità, MATLAB permette di generare rappresentazioni grafiche sia bidimensionali che tridimensionali.
Domanda
Qualcuno di voi ha già provato a fare grafici con Excel? e con Matlab ci ha mai provato?
THE END