
Here is my report as part of the Saturday Savers Club. This week I have a minus according to the display, but that's not quite true. What, how, why - you can read all about it here.
Nachdem ich vorletzte Woche über meine Sparziele berichtet habe, und letzte Woche dem Saturday Savers Club beigetreten bin (und erneut meinen Bericht abgeliefert habe), hier natürlich der Verlauf der letzten Woche.
Details about last week:
A few things I want to touch on, all in order.
Peakd “Account Growth” Graph
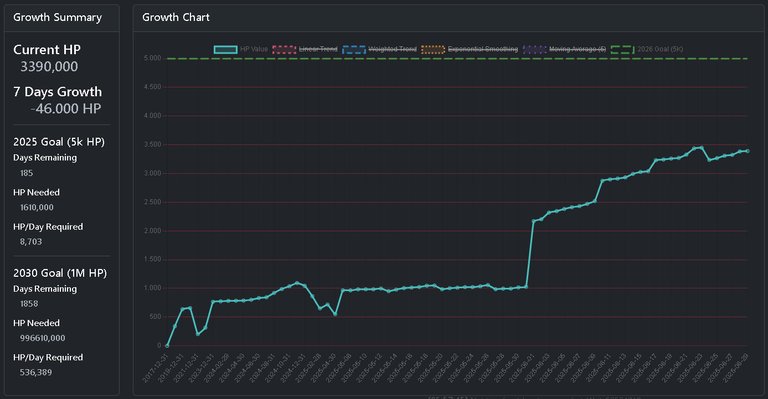
On the one hand, I noticed that the values on @Peakd's “Account Growth” graph are not constant. Within the last 2 weeks I have noticed several times that the values change - and I don't mean that the days of the previous day still change slightly. I've noticed several times that I suddenly have 10 or 20 HP more - retroactively over several days. I have not yet found out the reason for this. It would be interesting to know why, but I don't care, as I have now built such a graph myself in my own frontend. I will adapt it over the next few days, but basically I already like it better.
Gross -, net +
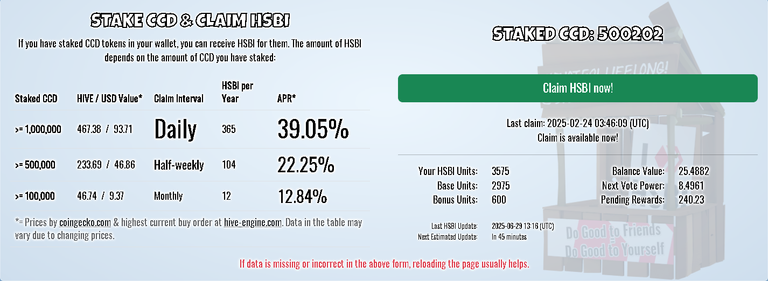
Before I go into another detail that is currently misrepresenting my figures: I have moved value within the last week. So a power-down at PowerPaul to transfer the values to second accounts to use them for trading. There should actually be 240 HP more - and that would put me back in the black. I'll have to think about whether I should adjust my data entry or the display here,
Shifting the date
I currently enter my data every day. For example, my Saturday Savers report today comes on Sunday; last week it was Saturday. However, my calculation “Last Week =” in the table displayed here always takes Friday as the benchmark. And the display of my graph always shows the current actual state; therefore today is Sunday 11:44 AM UTC. (I could have simply left out today's Sunday in today's presentation - then the table shown here does not match my screenshot of the graph...) And exactly this date shift is also the reason why, calculated from today, I have -46 HP compared to 7 days ago. But if I were to use my previous calculation day, Friday, I would be 52 HP in the black...
This leads to confusion, as at first glance the dates do not match. And of course today's Sunday in particular looks suboptimal in my graph, as the values for today's Sunday have not yet been fully taken into account...
I'll have to think about how I can achieve a more homogeneous representation. I already have an idea that could be easily integrated into my further programming plans for my frontend.
Once again in short form: don't be irritated if any figures appear to be different. I was irritated myself at first, but if you calculate the correct scales and days, then everything is correct...
Less activity on the chain
I was actually less active in the “Write articles” section on the Chain last week - but that shouldn't be reflected in the figures until next week. However, I have adjusted my actions in the Curation Rewards area and worked a lot on my front end, which will have a positive impact on my growth in the long term. I have already written a first teaser here - more will certainly come, as I want to make this frontend accessible to other “professional & ambitious” Hivians.
Then:
Details zur letzten Woche:
Ein paar Dinge will ich ansprechen, alles der Reihe nach.
Peakd "Account Growth" Graph
Einerseits ist mir aufgefallen, dass die Werte auf dem "Account Growth" Graphen von @Peakd nicht konstant sind. Innerhalb der letzten 2 Wochen habe ich mehrfach festgestellt, das sich die Werte ändern - und damit meine ich nicht, das sich die Tage des Vortages noch geringfügig ändern. Mehrfach, dass ich auf einmal 10 oder 20 HP mehr habe - rückwirkend auf mehrere Tage. Den Grund dafür habe ich noch nicht rausgefunden. Warum wäre interessant zu wissen, kann mir aber egal sein, da ich mir einen solchen Graphen mittlerweile in meinem eigenen Frontend selbst gebaut habe. Den werde ich noch die nächsten Tage über anpassen, im Grunde gefällt er mir aber jetzt schon besser.
Brutto -, Netto +
Bevor ich auf ein weiteres Detail eingehe, was meine Zahlen aktuell falsch darstellt: ich habe innerhalb der letzten Woche Wert umgelagert. Also ein Power-Down bei PowerPaul, um die Werte auf Zweitaccounts umzulagern, um diese für Trading zu benutzen. Eigentlich müssten da 240 HP mehr sein - und damit wäre ich wieder erneut dick im Plus. Ich muss mir mal überlegen, ob ich meine Datenerfassung bzw. die Darstellung hier anpasse,
Verschiebung des Datums
Aktuell pflege ich jeden Tag meine Daten ein. Mein Saturday Savers-Bericht kommt heute zum Beispiel am Sonntag; letzte Woche war es Samstag. Meine Kalkulation "Last Week =" in der hier angezeigten Tabelle nimmt aber immer den Freitag als Maßstab. Und die Anzeige meines Graphen zeigt immer den aktuellen Ist-Zustand an; folglich heute den Sonntag 11:44 AM UTC. (Ich hätte den heutigen Sonntag einfach auslassen können in der heutigen Darstellung - dann stimmt die hier abgebildete Tabelle nicht mit meinem Screenshot des Graphen überein...) Und genau diese Datumsverschiebung ist auch der Grund, warum ich, vom heutigen Tag gerechnet -46 HP habe, im Vergleich zu 7 Tagen davor. Würde ich aber meinen bisherigen Berechnungstag, den Freitag, heranziehen, wäre ich mit 52 HP im Plus...
Dies führt zu Verwirrungen, da auf den ersten Blick die Daten nicht übereinstimmen. Und gerade der heutige Sonntag sieht damit natürlich in meinem Graphen suboptimal aus, da die Werte des heutigen Sonntags noch nicht komplett mit einberechnet sind...
Ich muss mir mal überlegen, wie ich es mache, um ein homogenere Darstellung zu erwirken. Ich habe da schon eine Idee, welche sich super integrieren lässt, in meine weiteren Programmierungspläne meines Frontends.
Nochmal in Kurzform: seid nicht irritiert, wenn irgendwelche Zahlen abweichend erscheinen. Hat mich selbst erstmal irritiert; wenn man aber die korrekten Maßstäbe und Tage berechnet, dann stimmt alles...
Weniger Aktivitat auf der Chain
Tatsächlich war ich aber auch letzte Woche weniger aktiv im Bereich "Artikel schreiben" auf der Chain - das sollte sich aber erst nächste Woche in den Zahlen niederschlagen. Dafür habe ich aber meine Handlungen im Bereich Curation Rewards angepasst und viel an meinem Frontend gearbeitet, was sich langfristig positiv auf mein Wachstum auswirken wird. Einen ersten Teaser habe ich dazu bereits hier geschrieben - weiteres wird gewiss kommen, da ich dieses Frontend auch anderen "professionellen & ambitionierten" Hivians zugänglich machen möchte.
Sodann:

| Date | +/- | Total HP | to 5k HP | Days to 12/31/25 | ⌀ HP/day by 12/31/25 | to 1M HP | Days to 07/01/30 | ⌀ HP/day by 07/01/30 | KE | Event |
|---|---|---|---|---|---|---|---|---|---|---|
| 06/29/25 | +7 | 3390 | 1610 | 185 | 8.703 | 996,610 | 1,858 | 536.389 | 1.25 | |
| 06/28/25 | +60 | 3383 | 1617 | 186 | 8.694 | 996,617 | 1,859 | 536.104 | 1.25 | |
| 06/27/25 | +14 | 3323 | 1677 | 187 | 8.968 | 996,677 | 1,860 | 535.848 | 1.25 | 7 days ago = +52 HP |
| 06/26/25 | +42 | 3309 | 1691 | 188 | 8.995 | 996,691 | 1,861 | 535.567 | 1.25 | |
| 06/25/25 | +30 | 3267 | 1733 | 189 | 9.169 | 996,733 | 1,862 | 535.302 | 1.25 | |
| 06/24/25 | -211 | 3237 | 1763 | 190 | 9.279 | 996,763 | 1,863 | 535.031 | 1.25 | Power Down = -240 HP |
| 06/23/25 | +12 | 3448 | 1552 | 191 | 8.126 | 996,552 | 1,864 | 534.631 | 1.15 | |
| 06/22/25 | +140 | 3436 | 1564 | 192 | 8,146 | 996,564 | 1,865 | 534.351 | 1.15 | |
| 06/21/25 | +35 | 3296 | 1704 | 193 | 8.658 | 996,704 | 1,866 | 534.122 | 1.13 | |
| 06/20/25 | +11 | 3261 | 1739 | 194 | 8.912 | 996,739 | 1,867 | 533.867 | 1.13 | 7 days ago = +350 HP |
| 06/19/25 | +27 | 3250 | 1750 | 195 | 8.928 | 996,750 | 1,868 | 533.587 | 1.13 | |
| 06/18/25 | +12 | 3223 | 1777 | 196 | 9.061 | 996,776 | 1,869 | 533.310 | 1.13 | |
| 06/17/25 | +190 | 3212 | 1788 | 197 | 9.076 | 996,788 | 1,870 | 533.032 | 1.13 | |
| 06/16/25 | +15 | 3022 | 1978 | 198 | 9.989 | 996,978 | 1,871 | 532.848 | 1.18 | |
| 06/15/25 | +35 | 3007 | 1993 | 199 | 10.015 | 996,993 | 1,872 | 532.572 | 1.18 | |
| 06/14/25 | +60 | 2972 | 2028 | 200 | 10.14 | 997,028 | 1,873 | 532.305 | 1.20 | |
| 06/13/25 | +21 | 2912 | 2088 | 201 | 10.388 | 997,088 | 1,874 | 532.053 | 1.22 | 7 days ago = +521 HP |
| 06/12/25 | +14 | 2891 | 2109 | 202 | 10.440 | 997,109 | 1,875 | 531.781 | 1.21 | |
| 06/11/25 | +25 | 2877 | 2123 | 203 | 10.458 | 997,123 | 1,876 | 531.505 | 1.21 | |
| 06/10/25 | +352 | 2852 | 2148 | 204 | 10.529 | 997,148 | 1,877 | 531.234 | 1.21 | |
| 06/09/25 | +50 | 2500 | 2500 | 205 | 12.195 | 997,500 | 1,878 | 538.606 | 1.21 | Becoming a Worker Bee |
| 06/08/25 | +39 | 2450 | 2550 | 206 | 12.378 | |||||
| 06/07/25 | +20 | 2411 | 2589 | 207 | 12.507 | |||||
| 06/06/25 | +30 | 2391 | 2609 | 208 | 12.543 | 7 days ago = + 1,605 HP | ||||
| 06/05/25 | +35 | 2361 | 2639 | 209 | 12.626 | |||||
| 06/04/25 | +29 | 2326 | 2674 | 210 | 12.733 | |||||
| 06/03/25 | +115 | 2297 | 2703 | 211 | 12.810 | |||||
| 06/02/25 | +33 | 2182 | 2818 | 212 | 13.292 | |||||
| 06/01/25 | +1142 | 2149 | 2851 | 213 | 13.384 | Last month = + 462 HP | ||||
| 05/31/25 | +12 | 1007 | 3993 | 214 | 18.658 | |||||
| 05/30/25 | +20 | 995 | 4005 | 215 | 18.627 | 7 days ago = - 21 HP | ||||
| 05/29/25 | +1 | 975 | 4025 | 216 | 18.634 | |||||
| 05/28/25 | +10 | 974 | 4026 | 217 | 18.552 | |||||
| 05/27/25 | -71 | 964 | 4036 | 218 | 18.513 | |||||
| 05/26/25 | +/-0 | 1036 | 3964 | 219 | 18.100 | |||||
| 05/25/25 | +14 | 1036 | 3964 | 220 | 18.018 | |||||
| 05/24/25 | +/-0 | 1022 | 3978 | 221 | 18 | |||||
| 05/23/25 | +10 | 1022 | 3978 | 222 | 17.9189 | 7 days ago = + 8 HP | ||||
| 05/22/25 | +10 | 1012 | 3988 | 223 | 17.883 | |||||
| 05/21/25 | +17 | 1002 | 3998 | 224 | 17.848 | |||||
| 05/20/25 | -61 | 985 | 4015 | 225 | 17.844 | |||||
| 05/19/25 | +/-0 | 1046 | 3954 | 226 | 17.495 | |||||
| 05/18/25 | +22 | 1046 | 3954 | 227 | 17.418 | |||||
| 05/17/25 | +10 | 1024 | 3976 | 228 | 17.438 | |||||
| 05/16/25 | +10 | 1014 | 3986 | 229 | 17.406 | 7 days ago = + 31 HP | ||||
| 05/15/25 | +25 | 1004 | 3996 | 230 | 17.373 | |||||
| 05/14/25 | +28 | 979 | 4021 | 231 | 17.406 | |||||
| 05/13/25 | -46 | 951 | 4049 | 232 | 17.452 | |||||
| 05/12/25 | +13 | 997 | 4003 | 233 | 17.180 | |||||
| 05/11/25 | +/-0 | 984 | 4016 | 234 | 17.162 | |||||
| 05/10/25 | +1 | 984 | 4016 | 235 | 17.089 | |||||
| 05/09/25 | +18 | 983 | 4017 | 236 | 17.021 | 7 days ago = + 432 HP | ||||
| 05/08/25 | +/-0 | 965 | 4035 | 237 | 17.025 | |||||
| 05/07/25 | +414 | 965 | 4035 | 238 | 16.953 | |||||
| ... | ||||||||||
| 04/30/25 | -167 | 551 | 4449 | 245 | 18.159 | |||||
| ... | ||||||||||
| 03/31/25 | +66 | 718 | 4282 | 274 | 15.627 | |||||
| ... | ||||||||||
| 02/28/25 | -212 | 652 | 4348 | 305 | 14.255 | |||||
| ... | ||||||||||
| 01/31/25 | -180 | 864 | 4136 | 334 | 12.383 | |||||
| ... | ||||||||||
| 12/31/24 | -49 | 1044 | 3956 | 365 | 10.838 | |||||
| ... | ||||||||||
| 11/30/24 | +59 | 1093 | 3907 | |||||||
| ... | ||||||||||
| 10/31/24 | +49 | 1037 | 3963 | |||||||
| ... | ||||||||||
| 09/30/24 | +68 | 988 | 4012 | |||||||
| ... | ||||||||||
| 08/31/24 | +75 | 920 | 4080 | |||||||
| ... | ||||||||||
| 07/31/24 | +13 | 845 | 4155 | |||||||
| ... | ||||||||||
| 06/30/24 | +31 | 832 | 4168 | |||||||
| ... | ||||||||||
| 05/31/24 | +14 | 801 | 4199 | |||||||
| ... | ||||||||||
| 04/30/24 | +3 | 787 | 4213 | |||||||
| ... | ||||||||||
| 03/31/24 | +2 | 784 | 4216 | |||||||
| ... | ||||||||||
| 02/29/24 | +7 | 782 | 4218 | |||||||
| ... | ||||||||||
| 01/30/24 | +9 | 775 | 4225 | |||||||
| ... | ||||||||||
| 12/31/23 | +449 | 766 | 4234 | |||||||
| ... | ||||||||||
| 12/31/22 | +113 | 317 | 4683 | |||||||
| ... | ||||||||||
| 12/31/21 | -452 | 204 | 4796 | |||||||
| ... | ||||||||||
| 12/31/20 | +19 | 656 | 4344 | |||||||
| ... | ||||||||||
| 12/31/19 | +297 | 637 | 4363 | |||||||
| ... | ||||||||||
| 12/31/18 | +339 | 340 | 4660 | |||||||
| ... | ||||||||||
| 12/31/17 | 1? | 1? | 4999? |
Greetings from Paraguay!
Follow  for the confusing stuff!
No... Better follow @CryptoCompany & @BroBang, my game & blockchain project! You don't will regret it!
Your vote keeps development & fridges rollin'.
Rock 'n' Roll & Hive a great day!
Make the best out of it!


Here are our articles from the last 7 days:
(and on all of them the #commentrewarder is activated!)
• @powerpaul | [ENG/DEU] #FunkyFrameFriday | Musical Photo Contest Round #7 | Vote for Your Favourite Music Related...
• @cryptocompany | [ENG/DEU] Friday's Favor = Discount Day! Up to 40%!
• @powerpaul | [ENG/DEU] Your Chance to Make Hive a Better Place – Which Feature Do You Miss on Your Favorite Hive ...