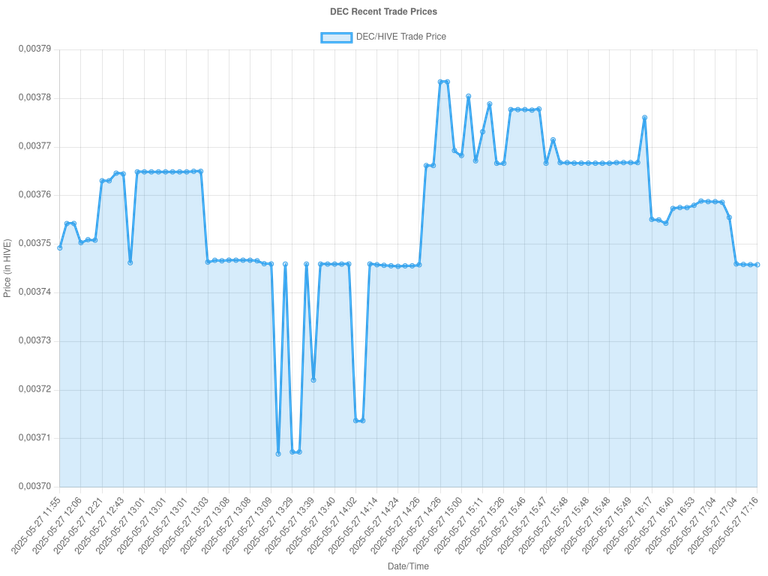
Here is a absolutely simple script to render a chart of recents trades for a Hive Engine token. Just chaing the tokenSymbol to whatever you want to draw.
const axios = require('axios');
const { ChartJSNodeCanvas } = require('chartjs-node-canvas');
const fs = require('fs');

const tokenSymbol = 'DEC';
const width = 1024;
const height = 768;
const chartJSNodeCanvas = new ChartJSNodeCanvas({ width, height });

async function fetchRecentTrades(symbol) {
  const payload = {
    jsonrpc: '2.0',
    method: 'find',
    params: {
      contract: 'market',
      table: 'tradesHistory',
      query: { symbol },
      limit: 100,
      offset: 0,
      indexes: [{ index: 'timestamp', descending: true }],
    },
    id: 1,
  };
  const response = await axios.post('https://api.hive-engine.com/rpc/contracts', payload);
  return response.data.result;
}

async function drawChart(tokenSymbol) {
  const trades = await fetchRecentTrades(tokenSymbol);

  // Sort trades by timestamp ascending
  trades.sort((a, b) => a.timestamp - b.timestamp);

  const labels = trades.map(trade => new Date(trade.timestamp * 1000).toISOString().slice(0, 16).replace('T', ' '));
  const prices = trades.map(trade => parseFloat(trade.price));

  const configuration = {
    type: 'line',
    data: {
      labels: labels,
      datasets: [{
        label: `${tokenSymbol}/HIVE Trade Price`,
        data: prices,
        borderColor: 'rgba(54, 162, 235, 1)',
        backgroundColor: 'rgba(54, 162, 235, 0.2)',
        fill: true,
        tension: 0.1
      }]
    },
    options: {
      plugins: {
        title: {
          display: true,
          text: `${tokenSymbol} Recent Trade Prices`
        }
      },
      scales: {
        y: {
          title: {
            display: true,
            text: 'Price (in HIVE)'
          }
        },
        x: {
          title: {
            display: true,
            text: 'Date/Time'
          }
        }
      }
    }
  };

  // Render chart to buffer and save as PNG
  const image = await chartJSNodeCanvas.renderToBuffer(configuration);
  fs.writeFileSync(`${tokenSymbol}_recent_trades.png`, image);
  console.log(`Chart saved as ${tokenSymbol}_recent_trades.png`);
}

drawChart(tokenSymbol);