~~~ La versione in italiano inizia subito dopo la versione in inglese ~~~
ENGLISH

23-07-2025 - System Analysis - The Bode and Nyquist Plots [EN]-[IT]
With this post, I would like to provide a brief introduction to the topic in question.
(code notes: X_79-78)
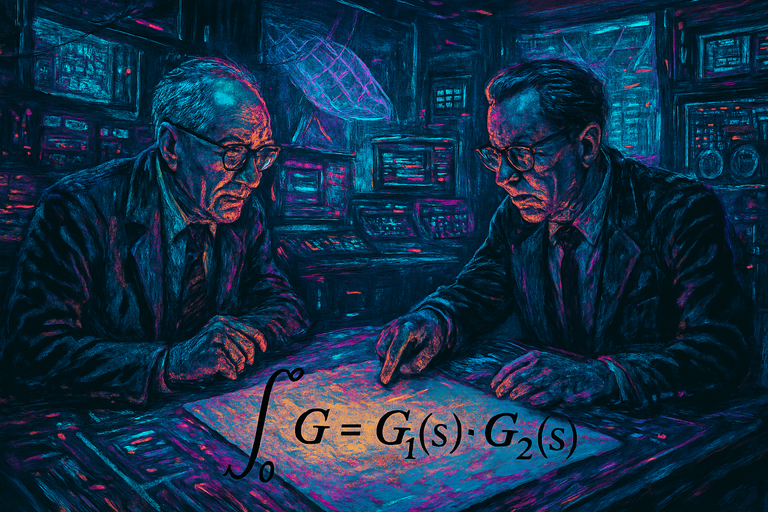
Image created with artificial intelligence, the software used is Microsoft Copilot
What does the Bode plot have to do with system analysis?
The Bode plot shows the frequency response of a Linear Time-Invariant (LTI) system, meaning it does not change its behavior over time.
Gain Margin and Phase Margin
The Bode plot is considered central to system analysis because this type of plot can be used to calculate the gain margin and the phase margin.
The gain margin and the phase margin are two stability indices and are very important indicators because they indicate how safe a control system is. The gain margin is how much the system's gain can be increased without the system becoming unstable. unstable, while the Phase Margin is how much phase delay can be induced before the system becomes unstable.
Control Sizing
In a system, its control process is fundamental, so the sizing of the control, which can be done with the Bode plot, also becomes important. In this case, it helps make decisions about where to insert the poles/zeroes. Furthermore, another very important thing is that it helps understand how to increase the bandwidth without compromising the stability of the system itself.
Sinusoidal Signals
Another magic of the Bode plot is the help it provides in showing us how the system is capable of amplifying or attenuating signals at different frequencies.
Example
Below is an example of a Bode plot where the frequency is on the x-axis and the phase.
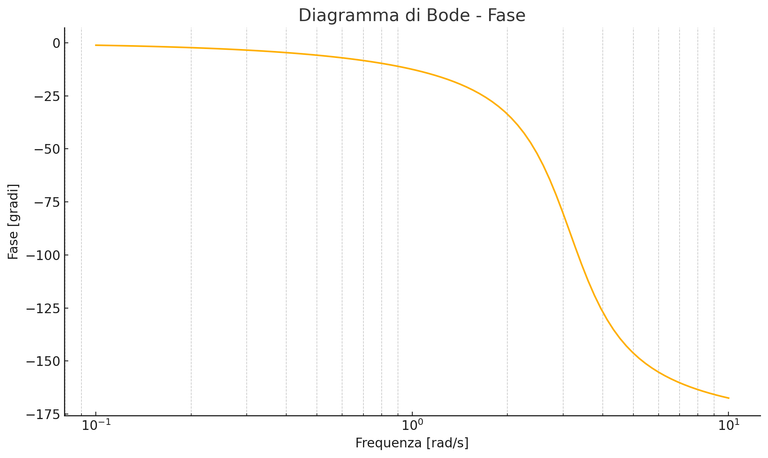
image created with artificial intelligence, the software used is ChatGPT
This diagram represents the Bode-Phase plot of a linear time-invariant dynamic system. Essentially, it shows how the phase of the transfer function changes as a function of frequency.
Bode plots are very useful for systems with a transfer function. The transfer function is denoted by G(s) and describes the dynamic behavior of the system being studied. The transfer function shows how much and how the output depends on the input.
Below, I'll show you how the transfer function looks mathematically. Transfer:
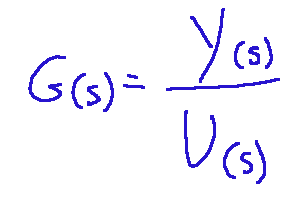
Where:
U(s) = the system input, transformed into the Laplace domain
Y(s) = the system output (also in the Laplace domain),
s = is the complex Laplace variable
G(s) = is the input-output relationship in the frequency domain
Diagram of Nyquist
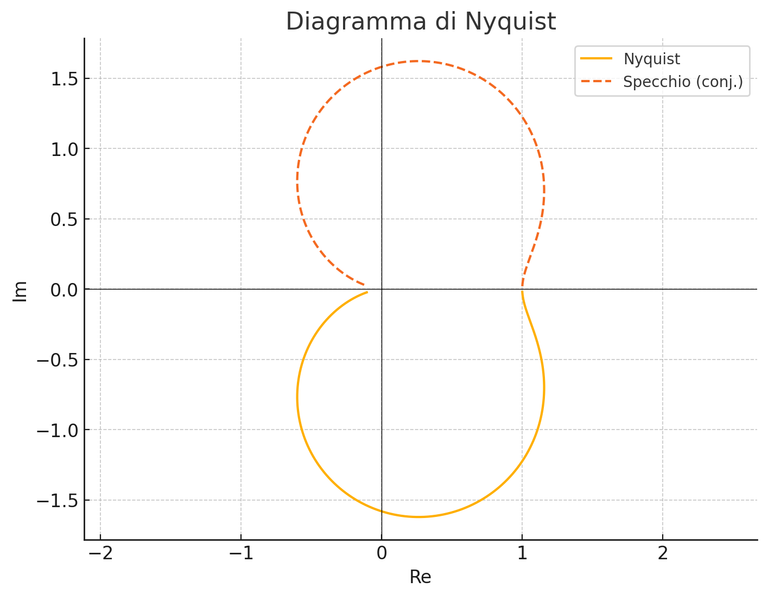
Image created with artificial intelligence, ChatGPT software used
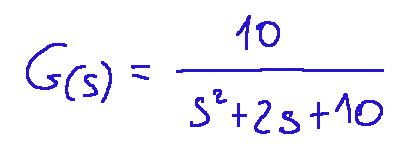
Above is an example of a Nyquist plot calculated for the following transfer function:
In this graph The orange curve represents the plot for ω>0, while the dashed curve is the symmetric conjugate for ω<0.
But what does the Nyquist plot represent?
Here too, we are faced with one of the most useful tools in system analysis and modeling. With this plot, we can evaluate the stability of feedback systems. Today, systems have an entire control system, and therefore the stability of the feedback has become crucial.
Feedback, simply put, is the feedback provided by the system and is a type of control system in which the output data is fed back to the input to influence the behavior of the system itself.
Conclusions
When analyzing a system, we can use the Bode plot to understand how the system behaves with respect to various frequency stimuli. This will allow us to intervene concretely to improve the system we are analyzing. The Nyquist plot, on the other hand, can be used to evaluate the feedback of a control system.
Question
Did you know that Hendrik Wade Bode (1905–1982), who introduced his Bode plot in 1938, received little attention because it was seen as too much of an engineering method (waiting for something simpler), but is now widely adopted for its practical simplicity? Bode and Harry Nyquist were excellent scientists and visionary engineers who both worked at Bell Labs, but they didn't always get along with each other. Did you know how some of their disagreements ended? Time proved them both right.
![]()
ITALIAN

23-07-2025 - Analisi dei sistemi - Il diagramma di Bode e di Nyquist [EN]-[IT]
Con questo post vorrei dare una breve istruzione a riguardo dell’argomento citato in oggetto
(code notes: X_79-78)
immagine creata con l’intelligenza artificiale, il software usato è Microsoft Copilot
Cosa c'entra il diagramma di Bode con l'analisi dei sistemi?
Il diagramma di Bode mostra la risposta in frequenza di un sistema LTI (Linear Time-Invariant, cioè che non cambia comportamento nel tempo.
gain margin e phase margin
Il diagramma di Bode è ritenuto centrale nell'analisi di sistemi perchè con questa tipologia di diagrammi si possono ricavare il gain margin ed il phase margin.
Il gain margin ed il phase margin sono due indici di stabilità e sono indici importantissimi perchè indicano quanto è sicuro un sistema di controllo. Il Gain Margin è quanto si può aumentare il guadagno del sistema senza che il sistema non diventi instabile, mentre il Phase Margin è quanto ritardo di fase può essere indotto prima che il sistema diventi instabile.
Dimensionamento del controllo
In un sistema il suo processo di controllo è fondamentale, quindi diventa importante anche il dimensionamento del controllo che può avvenire con il diagramma di Bode. In questo caso aiuta a prendere le decisioni rispetto a dove inserire i poli/zeri, inoltre, altra cosa molto importante, aiuta a capire come aumentare la banda senza compromettere la stabilità stessa del sistema.
segnali sinusoidali
Altra magia del diagramma di Bode è l'aiuto che da nel mostrarci come il sistema sia in grado di amplificare o attenuare i segnali a diverse frequenze.
Esempio
Qui di seguito un esempio del diagramma di Bode dove abbiamo sull'asse x la frequenza e sull'asse y la fase.
immagine creata con l’intelligenza artificiale, il software usato è ChatGPT
Questo diagramma rappresenta il diagramma di Bode-Fase di un sistema dinamico lineare tempo-invariante. Sostanzialmente mostra come la fase della funzione di trasferimento in funzione della frequenza.
Il diagramma di Bode sono molto utili per sistemi con funzione di trasferimento. La funzione di trasferimento si indica con G(s) e descrive il comportamento dinamico del sistema che si sta studiando. La funzione di trasferimento mostra quanto e come l’uscita dipende dall’ingresso.
Qui di seguito ricordo come si presenta matematicamente la funzione di trasferimento:
Dove:
U(s)= l’ingresso del sistema, trasformato nel dominio di Laplace
Y(s)= l’uscita del sistema (anch'essa nel dominio di Laplace),
s= è la variabile complessa di Laplace
G(s)= è la relazione ingresso-uscita nel dominio della frequenza
Diagramma di Nyquist
immagine creata con l’intelligenza artificiale, il software usato è ChatGPT
Qui sopra un esempio del diagramma di Nyquist calcolato per la seguente funzione di trasferimento:
In questo grafico la curva arancione rappresenta il tracciato per ω>0, mentre la curva tratteggiata è il coniugato simmetrico per ω<0.
Ma cosa rappresenta il diagramma di Nyquist?
Anche qui siamo di fronte ad uno degli strumenti più utili in analisi e modellistica dei sistemi. Con questo diagramma possiamo valutare la stabilità dei sistemi retroazionati. Oggi i sistemi hanno tutto un sistema di controllo e quindi la cosa fondamentale è diventata la stabilità della retroazione.
La retroazione in parole semplici è il feedback che fornisce il sistema ed è un tipo di sistema di controllo in cui il dato dell'uscita viene riportata all'ingresso per influenzare il comportamento del sistema stesso.
Conclusioni
Quando stiamo facendo un analisi di un sistema possiamo usare il diagramma di Bode per comprendere come il sistema si comporta rispetto ai vari stimoli in frequenza. Questo ci permetterà di intervenire concretamente per migliorare il sistema che stiamo analizzando. Si può usare invece il diagramma di Nyquist per valutare i feedback di un sistema di controllo.
Domanda
Lo sapevate che Hendrik Wade Bode (1905–1982) che introdusse il suo diagramma di Bode nel 1938, ottenne poca visibilità perché fu visto come un metodo troppo ingegneristico (in attesa di qualcosa di più semplice) ed invece adesso è ampiamente adottato per la sua semplicità pratica? Bode e Harry Nyquist erano scienziati eccellenti ed ingegneri visionari che lavoravano entrambi a Bell Labs, ma non sempre andavano d'accordo l'uno con l'altro. Lo sapevate come finirono alcune diatribe tra di loro? Il tempo dimostrò che entrambi avevano ragione.
THE END